Samsung to Demo Foldable/Slidable Hybrid
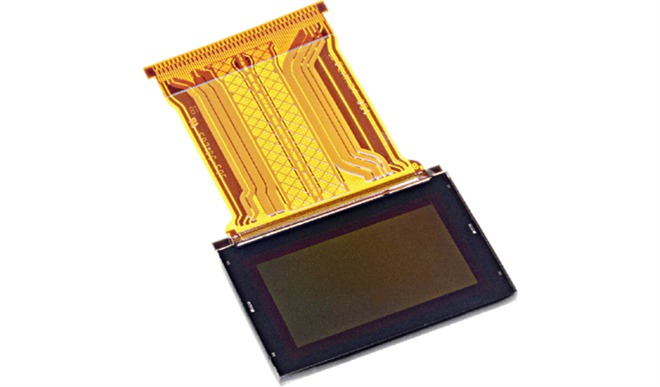
As PR heats up for the upcoming CES show (Jan. 5), Samsung Display (pvt) will show a demo of a hybrid foldable/slideable display device to potential customers. The display which looks like a smartphone with an 8” diagonal (assuming a 9:16 aspect ratio), which would have ~27.8 in2 of display space, and could unfold to a 10” diagonal, which would increase the display space to ~50 in2, and then would be able to slide a rolled up display to give a diagonal of 12.5”, which would give ~72.2 in2 of display space. The display will be capable of expanding from smartphone size to that of a tablet and to laptop size, or a ~264% increase in area by our calculations.
While there is no assurance that such a display will be used in a device in the near future, Samsung Electronics (005930.KS) has indicated that it will be expanding its foldable line in 2023 and 2024 to include new formats. The only difficulty we foresee with such a consumer device would be product placement as it could be construed as a replacement for all three current devices, and could cannibalize existing or future individual category device sales. That said, a device such as this, especially a 2nd generation device where inevitable initial issues could be addressed, would be a big step forward for the mobile CE space.
While there is no assurance that such a display will be used in a device in the near future, Samsung Electronics (005930.KS) has indicated that it will be expanding its foldable line in 2023 and 2024 to include new formats. The only difficulty we foresee with such a consumer device would be product placement as it could be construed as a replacement for all three current devices, and could cannibalize existing or future individual category device sales. That said, a device such as this, especially a 2nd generation device where inevitable initial issues could be addressed, would be a big step forward for the mobile CE space.
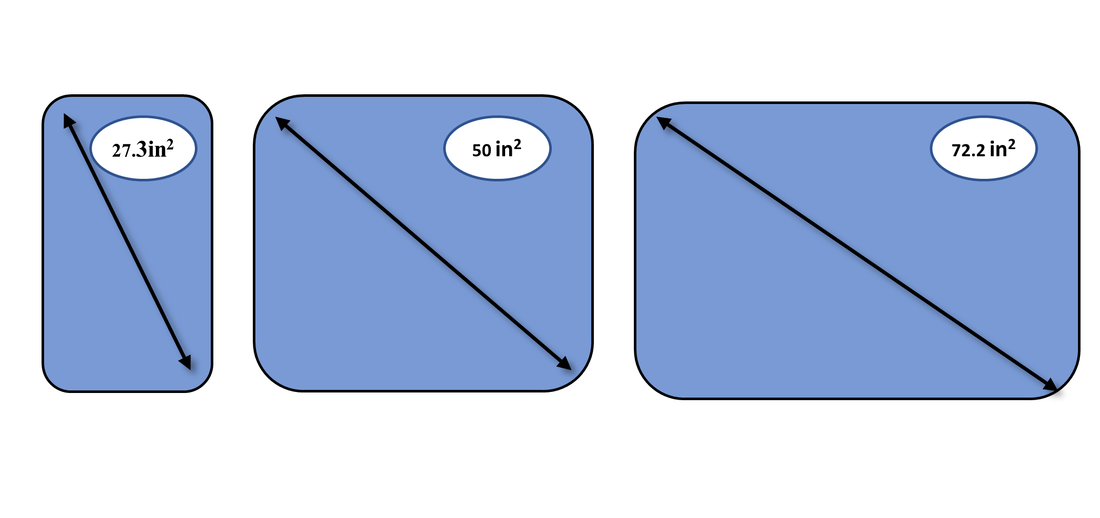
Samsung Display - Hybrid Demo


 RSS Feed