Universal Display – Goldilocks Quarter
Universal Display (OLED) reported 1Q results of $134m and EPS of $1.08 against consensus estimates of $119.6m and $0.79. Revenue was down 5.1% q/q but up 19.3% y/y after record 4Q ’20 sales. Material sales, which are the basis for royalty & license revenue recognition under ASC-606 were $79.8m (59.6% of sales), leading to an OLED material gross margin of 73.7%, up from 60.7% last quarter and 66.9% overall in 2020.
As UDC is extremely dependent on a relatively small number of large customers, and a both volatile and cyclical industry, investors should expect the company’s performance to be a bit more unpredictable than most, and tending toward ‘unusual’ events coloring quarterly results. This quarter was different however, with no unusual events, just stronger than expected results, however we expect there will be some concern from the analytical community concerning the company’s guidance, which remained in a range of $530m to $560m after beating 1Q consensus by over $14m, with previous comments implying that 2H would be better than 1H.
The company indicated that due to the uncertainty surrounding semiconductor shortages, they remained comfortable with the previous guidance, which we believe to be the same basic attitude that many of the company’s customers also have, regardless of whether it is stated publicly. As the impact of the semiconductor shortage filters through the CE supply chain, uncertainty increases and a generally more conservative outlook is warranted. In the same vein, if OLED panel producers are finding that their production volumes are being limited by component shortages, logic says to slow expansion plans, which is a large part of UDC’s growth story, and while that has a relatively small impact on near-term quarters, it is certainly part of the perceptional value of UDC. On the flip side, the rapidly rising prices of LCD panels has narrowed the gap between the cost of OLED and LCD panel equivalents, which is a key to the expansion of OLED application penetration which drives demand growth.
Material sales are the key metric we watch concerning UDC, and that breaks down into red and green categories. Red phosphorescent material is used in every OLED RGB device, which loosely means smartphones, tablets, and notebooks. While red material sales should track with small and medium panel OLED production, OLED recipe changes and material reduction programs make those comparisons less meaningful, however both overall material sales and red material sales should be increasing on a yearly basis. Investors seem to have an undue focus on quarterly material sales, so we show overall material sales in Fig. 1, quarterly red emitter sales in Fig. 2, and ‘smoothed’ (6 quarter average) red emitter sales, to remove some of the effects of seasonality and varied quarterly order patterns.
Red emitter sales reached a new record level of $19.1m, exceeding the previous peak of $18.3m in 4Q ’17, with the trend line continuing its upward path, while the ‘smoothed’ red emitter sales trend remains relatively stable over the last two years.. Green emitter material is also used in all small and medium panel RGB displays, at least for the last three years, but is also the basis for large panel OLED TV displays, which use UDC’s yellow/green phosphorescent emitter material and a blue fluorescent emitter produced by others. This implies that green material sales, which also reached a new high in 1Q ’21, should reflect both small and large panel OLED production, which is shown in Fig. 4 and Fig. 5, and as LG Display (LPL) is the primary supplier of OLED TV displays, it reflects LGD’s continued capacity expansion and increasing unit volume.
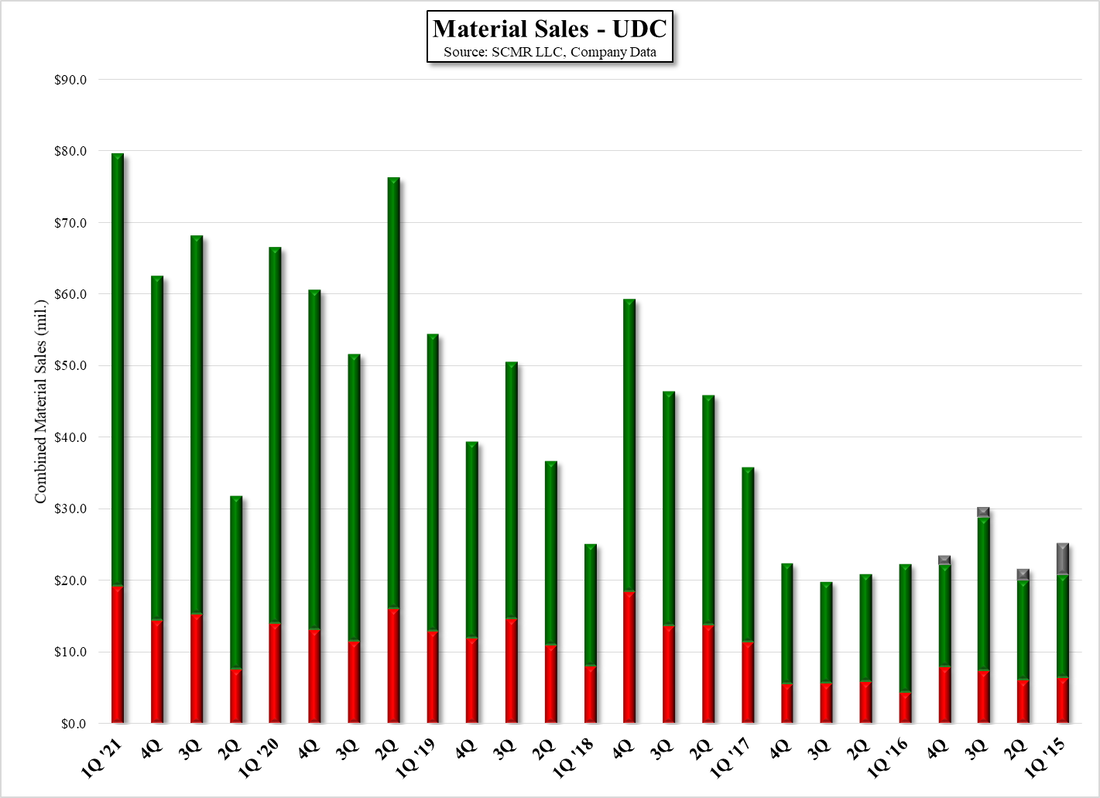
Material Sales - UDC - Source: SCMR LLC, Company Data

Red Emitter Material Sales - Source: SCMR LLC, Company Data

Red Emitter Sales - 6 Quarter Average - Source: SCMR LLC, Company Data

Green Emitter Material Sales - Source: SCMR LLC, Company Data

Green Emitter Sales - 6 Quarter Average - Source: SCMR LLC, Company Data
We had two concerns heading into UDC’s quarter, the first being the rapid increase in the price of one of UDC’s raw materials, Iridium, which has seen a price increase since the end of last year of 3.8x, rising from ~$1,700/oz. to ~$6,400/oz. While this is only one component of UDC’s emitter materials, the magnitude of the increase has been concerning, and UDC’s customer material contracts tend to be price/volume oriented, leaving little room for adjustments, which gave us concern about material margins. This turned out to be unwarranted, as material margins rose from 60.7% in 4Q ’20 and 69.6% in 1Q ’20, to 73.7% in 1Q ’21. As can be seen in Fig. 7, the company has been building raw material inventory, including iridium, at a trend line rate higher than the sales trend line rate, to insure apple supply.
Equally as important as available raw material inventory are how UDC’s material margins are affected by the mix between developmental and commercial materials, with developmental margins the lower of the two. When customers are developing OLED production, testing new materials, or running non-commercial production in new fabs, the materials are classified as developmental. Once the fab begins to sell commercial product to customers, those materials become commercial and are billed at commercial contract rates, so we make the assumption that some of UDC’s customers, likely Chinese customers, have been purchasing developmental emitter materials and have now begun commercial production, accounting for the higher material margins. We expect the mix to change each quarter as new fabs or line starts test production mode or moves into commercial fabrication, but it seems that the mix is more of an influence on material margins than the cost of OLED materials, which has remained relatively stable to date.
Equally as important as available raw material inventory are how UDC’s material margins are affected by the mix between developmental and commercial materials, with developmental margins the lower of the two. When customers are developing OLED production, testing new materials, or running non-commercial production in new fabs, the materials are classified as developmental. Once the fab begins to sell commercial product to customers, those materials become commercial and are billed at commercial contract rates, so we make the assumption that some of UDC’s customers, likely Chinese customers, have been purchasing developmental emitter materials and have now begun commercial production, accounting for the higher material margins. We expect the mix to change each quarter as new fabs or line starts test production mode or moves into commercial fabrication, but it seems that the mix is more of an influence on material margins than the cost of OLED materials, which has remained relatively stable to date.
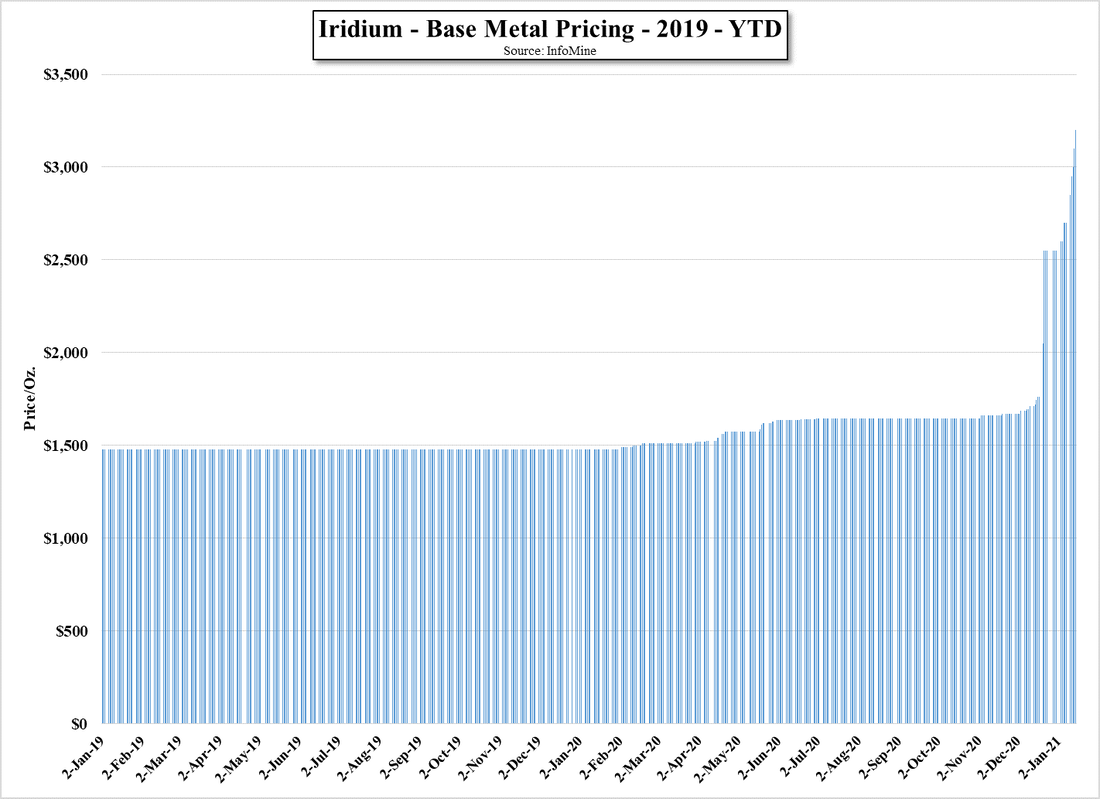
Iridium Sales Price - 5/2019 - 5/2021 - Source: umicore
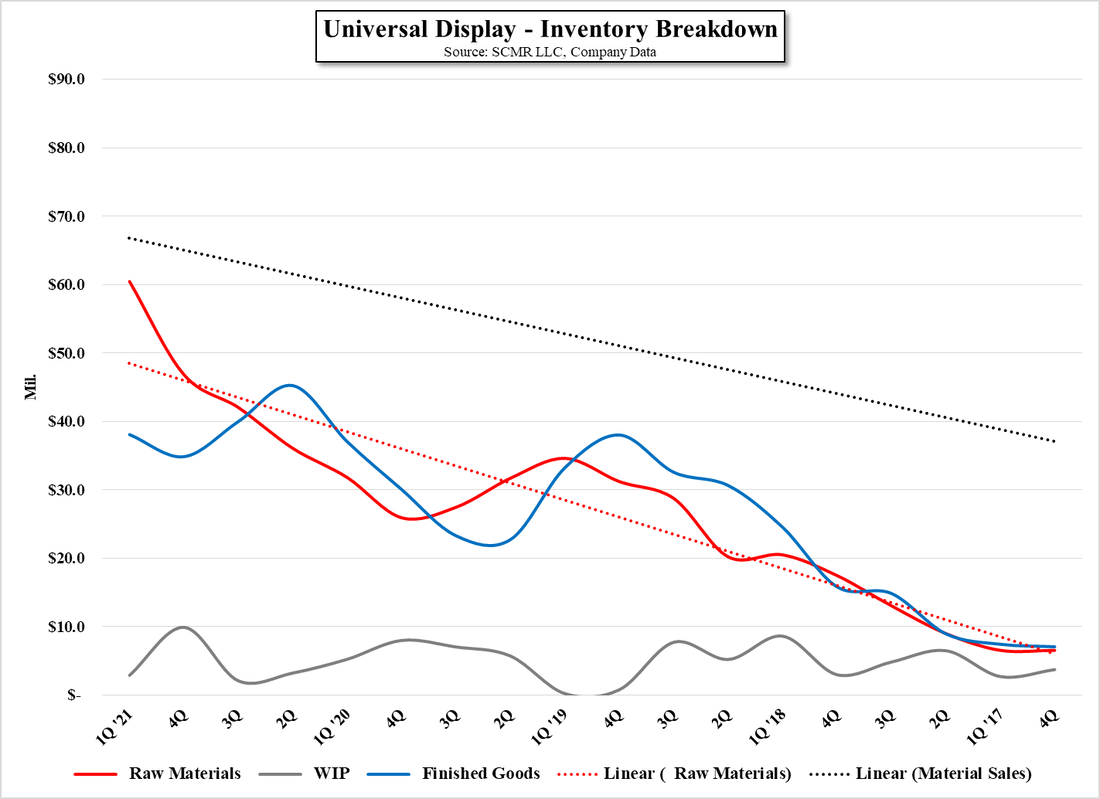
Universal Display - Inventory Breakdown - Source: SCMR LLC, Company Data
Our second concern was the impact of the new agreements UDC has signed recently, particularly that with LG Display, who is a primary customer of the company’s yellow/green phosphorescent emitters. The previous agreement with LGD is based on material sales and a royalty on the factory exit price of the displays. We expect that this has remained the case, as we believe that Samsung Display (pvt) is the only UDC customer that pays a flat yearly royalty rather than a unit based royalty, but the contract material purchase price or volume discounts for this new extended agreement could have changed, and while we expect such changes would be reflected over time, our concern was whether it would have an impact on green material sales in 1Q or in the company’s overall 2021 guidance. The only indication of a change relating to the new contract with LG Display is an increase in deferred revenue, which we expect is a result of the overall higher material volumes amortized over the life of the new contract under ASC 606.
We also look at UDC’s customer and regional sales data to better understand material sales trends. On a regional basis China has been UDC’s biggest growth market, and while China’s share of UDC’s sales did not beat its earlier peak (2Q ’19 – 47%), it came close at 45%. That said, the same quarterly variability seen in emitter sales applies here, and we look more toward the trend than the quarterly metrics. Fig. 9 and Fig. 10 break out quarterly regional share but also show regional sales trends, and while Korea’s share of UDC’s revenue continues to decline, the sales trend line remains positive. As China continues to grow its OLED capacity, both share and sales continue to grow. Given that the top four UDC customers were 91% of sales this quarter, and consisted of two Korean OLED producers (Samsung Display and LG Display) and two Chinese OLED producers (BOE (200725.CH) and Tianma (000050.CH)), other regions tend to be almost immaterial.
All in, 1Q 2021 was an unusually ‘normal’ quarter for UDC, continuing trends with few unusual deviations, and stronger sales than expected. We do not disagree with the company’s relatively conservative guidance for the year, which is up 27.1% y/y at the mid-point of guidance, as we are still in the midst of a very fluid CE market that seems to change on a weekly basis. In a less volatile circumstance, we would have to assume that UDC’s discussions with its customers were specific and pointedly pushed the company toward the possibility that the CE space could look different in 2H than originally expected, but we expect those discussions were more toward “too early to tell” than “changes are coming”. Despite the perceived meaning of steady guidance after a stronger than expected quarter, it was still a stronger than expected quarter and keeps UDC on track toward long-term growth.
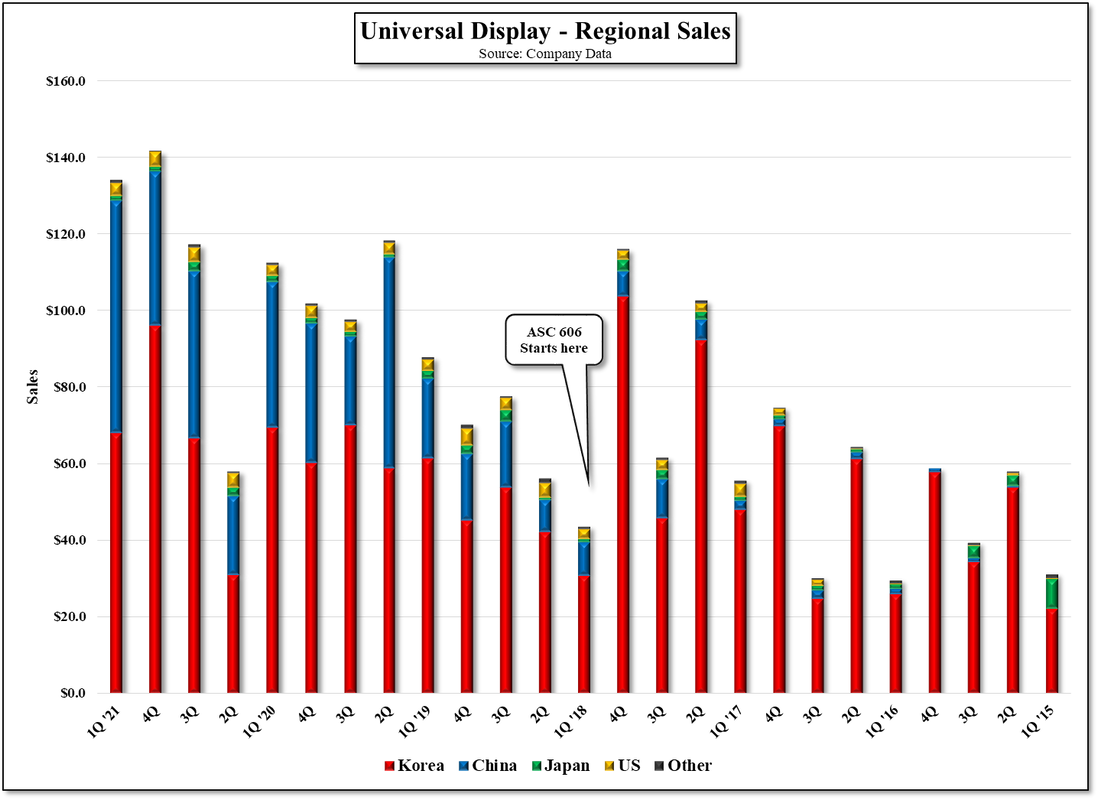
Universal Display - Regional Sales - Source: SCMR LLC, Company Data
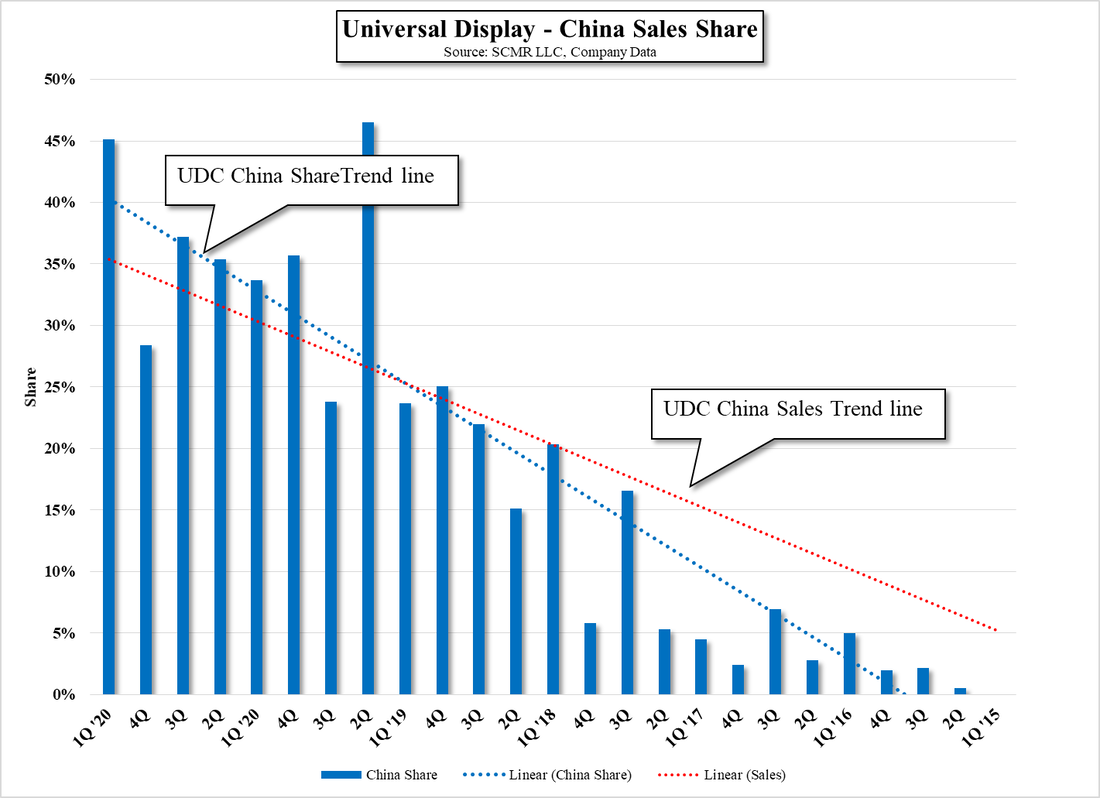
Universal Display - China Sales Share - Source: SCMR LLC, Company Data
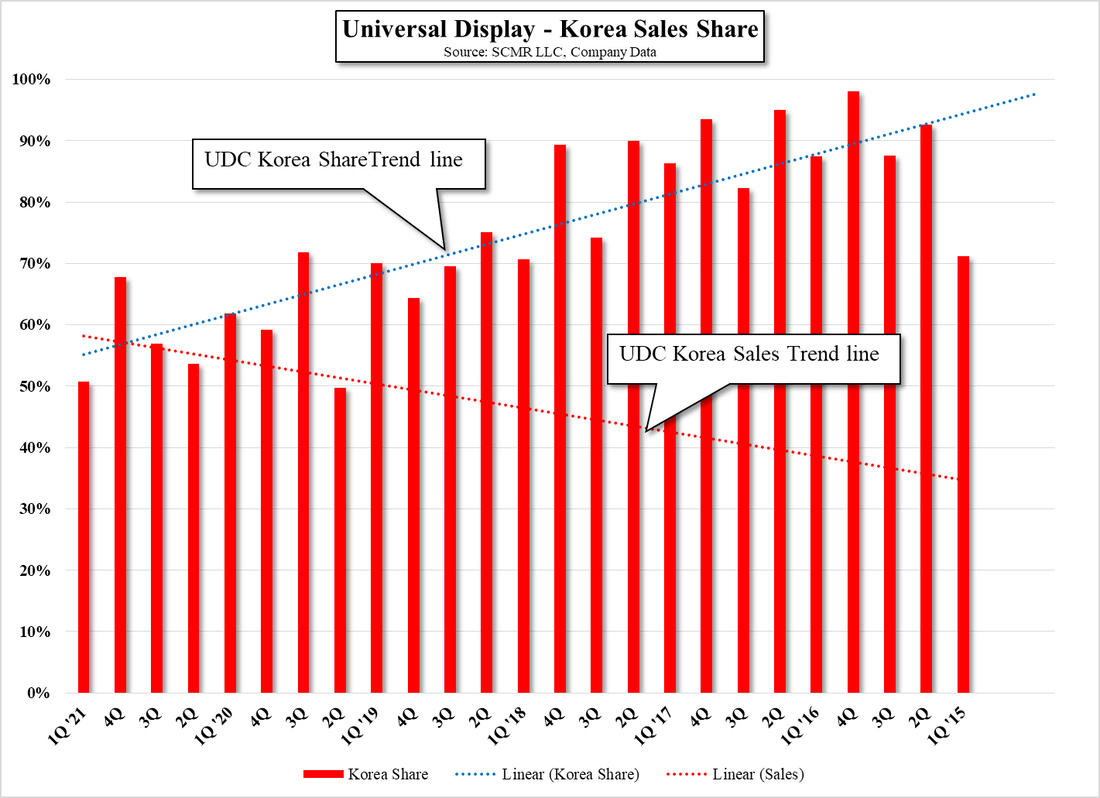
Universal Display - Korea Sales Share - Source: SCMR LLC, Company Data
 RSS Feed