Supply Chain Market Research - SCMR LLC
  • Blog
  • Home
  • About us
  • Contact

·      Panel Producer Metrics - November

12/29/2022

0 Comments


Panel Producer Metrics - November

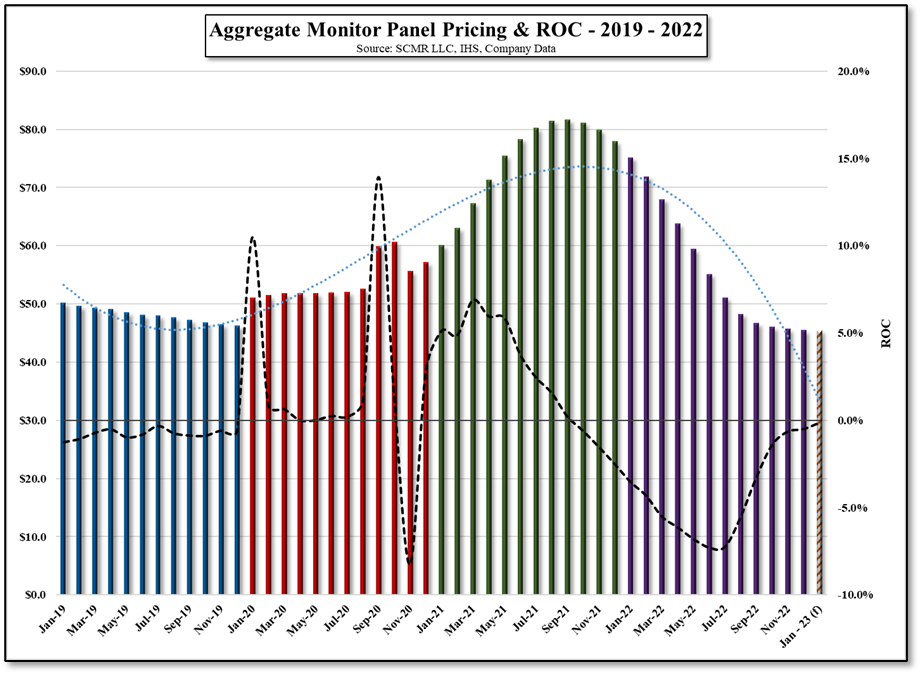
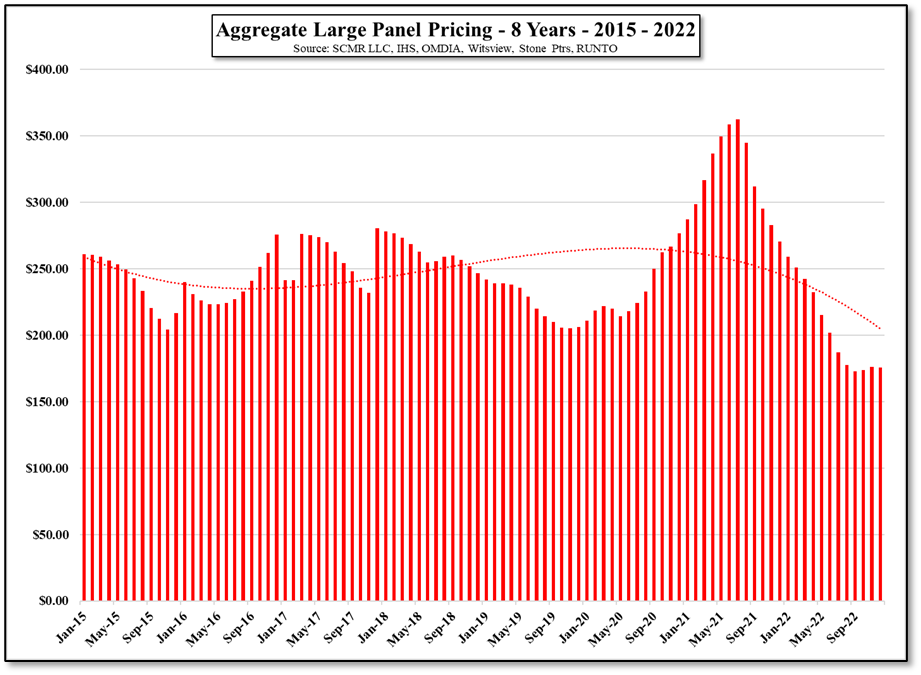
Earlier this week we reviewed panel pricing for December and the year, and we are close to having full data for panel producer sales in December and for the full year.  In the interim, we show results for November, which were slightly better than October, and walk through the display industry on a regional and company by company basis. 
November large panel revenue was up 0.8% m/m but down 30.9% y/y which puts the 2022 YTD (11 months) down 25.8% y/y, while large panel shipments are down 10.7% over the same period.  On a regional basis, both Taiwan and Korea saw m/m revenue increases, surprising in that Samsung Display (pvt) has been winding down large panel LCD production capacity as has LG Display (LPL) to a lesser degree.  Chinese large panel LCD producers saw their overall revenue share decline, following October’s rise, and has seen its revenue share decline YTD from 49.0% in December of last year to 46.6% in November of this year, while Korea has seen its share increase from 19.0% last December to 28.0% this year.
Picture
From a company perspective, out of the 10 large panel LCD producers that make up the bulk of sales for the space, 4 saw positive m/m results for November, while the remaining six saw m/m declines.  Of the four that saw positive m/m revenue growth in November, two were Taiwanese, one Korean, and one Chinese, while none are up on a y/y basis.  As noted, industry revenue is down 30.9% y/y for the 11 months and looking at the top 10 large panel LCD display producers, only two are above the average, with the remaining 8 below.  LG Display performed the best on a YTD y/y basis and CEC Panda (600775.CH) the worst.  All in November was, as expected, a relatively quiet month, as panel producers remained beholden to continuing weakness in China, weak early holiday sales, and little change in panel pricing.  We expect little change again in December.
Picture
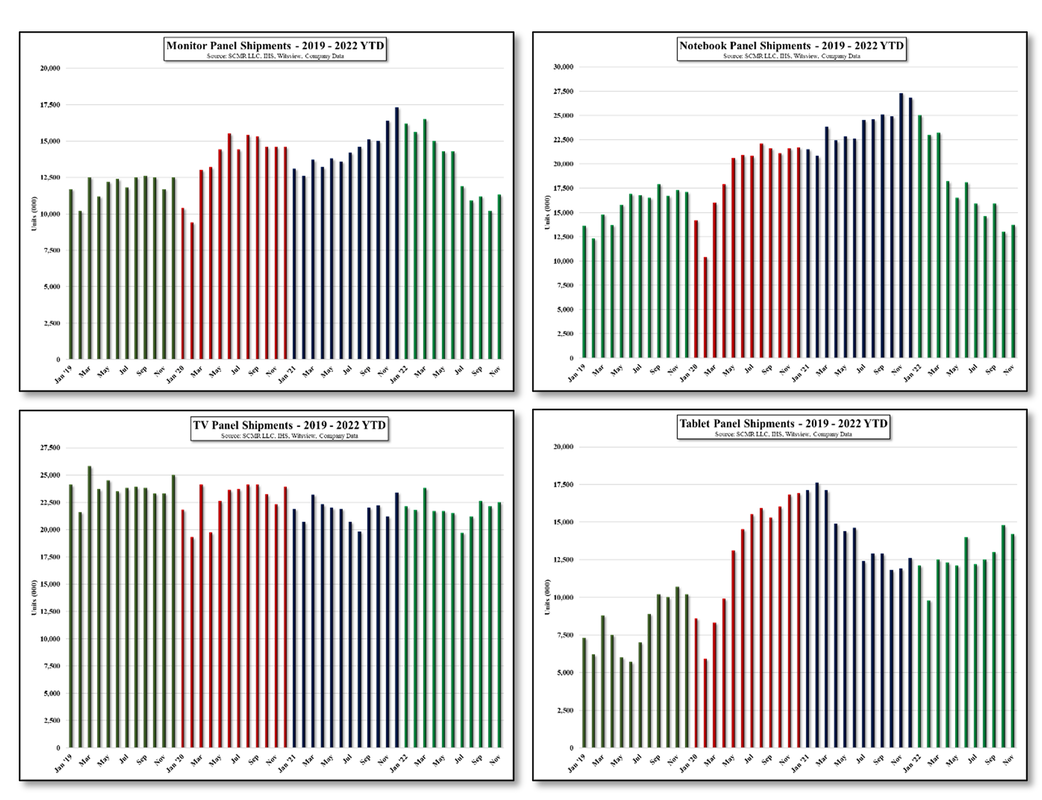
Large Panel LCD Display Shipments - 2020 - 2022 YTD - Source: SCMR LLC, OMDIA, Witsview, RUNTO, Company Data
Picture
0 Comments

December 28th, 2022

12/28/2022

0 Comments


Picture
Sitting around the TV in the 1950's - Ozzie & Harriet Nelson - Source: Life
If you are old enough, you might remember sitting in front of the TV with your entire family watching the Apollo 11 moon landing, along with 650 million other folks, or more recently, the last episode of ‘Friends’ in 2004, viewed by 52.5m folks.  But the days of families sitting around the TV are gone, replaced by DVRs and streaming services that allow viewers to work and play on their own schedules and not those of major networks.  Just to recap, there was a time when TV programs were broadcast at a very specific time, and if you were unable to sit in front of the TV exactly at that time, you missed your show, no VCR and few, if any, rebroadcasts, just gone into the archives of old TV programs (hopefully).
Picture
1969 Moon Landing - Source: History.com
​Such is no longer an issue, with the ability to time shift and the availability of a wide variety of copper or fiber systems that rebroadcast an endless supply of ‘Seinfeld’, ‘Law & Order’, or ‘The Simpsons’, and streaming services that compete for eyeballs and wallets with both existing and in-house content.  But no longer is the data on who is watching what in the public domain, as typical viewership services like Nielsen (NLSN) and Comscore (SCOR) are unable to gather the same comprehensive data that they used to derive by tabulating every second of TV watching from a selected group of ‘families’.  DVR usage is only able to be tracked voluntarily, and streaming services only provide data sporadically, usually when the data is good, so trying to understand who is watching what has become a much more complex issue.
Picture
Of course, the connection to consumer electronics is obvious, as every viewer is using some sort of display, be it a conventional TV, tablet, PC, or smartphone, and said devices all fall under the CE banner, but we were surprised when we learned of how opaque viewing data has become, and how segmented viewership is today.  Here’s an example made public by “The Hollywood Reporter”, a showbiz rag that was able to gain access to the data for the premier 2nd season episode of “Abbot Elementary”, a show coming off of two Emmy wins.  2.92m viewers watched S2E1 on its home channel, ABC (DIS) during the first 7 days of its broadcast, which would be considered mediocre, but when added to the 2.68m viewers who saw the episode on Hulu (DIS) or the ABC streaming app and the 1.38m viewers who watched it on their DVR (Nielsen data), ratings fall back into a range commensurate with the series’ success.
With broadcast viewers having only a slightly larger share than Hulu/ABC Streaming, the cross-platform data becomes increasingly important, however it seems that each network calculates that data differently.  For example, HBO (WBD) touted a massive 44m viewers who watched the final episode of “Game of Thrones”, but that included up to 6 weeks of streaming and replays of the season premiere, along with 5 weeks of episode 2, and, well you get the picture…  Nielsen, at least, has expanded its sample households from ~5,000 in 1997 to 40,000 homes (100,000 people) in 2020 and continues to do so, accordingly a 2.0 rating now equates to a 2% share of the adults between the ages of 18 and 49, or about 2.56m viewers.  This means there is no real standard for viewership currently, and the combined data tends to be revealed only in discussions between advertisers, content creators, streaming services, and networks with only snippets of information available to the public.
That said, there is some data, at least on a general basis that can be derived, with the basis being ‘same-day ratings’, essentially anyone who watches a show on the night it airs (up until 3AM the next day).  Live sports and news programs tend to be the bulk of same-day ratings, as magazine-based shows like “20/20” are often delayed by viewers, with Dramas high in the same-day mix.  Comedies tend to be delayed and entertainment shows fall between 40% and 50% viewership on the night they are aired, but with DVRs typically part of a cable or satellite system, and that category losing ~25m homes since the peak in the 2017 – 2018 season, so the lift formerly seen over the 7 day period after a show was aired (captured on DVR) has also dropped by 29%, and overall same-day viewing has declined by almost 33% over the same period, which puts streaming data as an increasingly important metric for the industry.
There are many new services that have proprietary measurement systems for streaming data, but black box systems can only guess at the hard data that most streamers keep to themselves and the fact that many viewers do not watch on standard TV platforms.  HBO reported that an average of 9m viewers were ‘first-nighters’ for its “House of the Dragon”, but it turns out that only 1.87m actually watched it at 9PM when it was originally broadcast on HBO, and similarly the Showtime (CBS) series “Yellowjackets”, which averaged ~5m viewers during the first season, had barely 6% of viewers watching on its first on-air showing.  This has led streaming services to use terms like ‘over the course of the run’ , ‘Live+35’, or ‘over 4 weeks’ when giving out numbers, as longer periods are added to statistics to allow shows to look like progressively bigger hits.
With new data providers promising better and more accurate data, advertisers have to work their way through considerably more data than when Nielsen was the only data available, and each advertiser has their own favorite metrics.  Some look at numbers for those that watch at least a minute or two of shows while others look at time spent, but as streaming services focus more on ad-supported services, ad buyers will need considerably more data than the streaming service itself might provide, and while there is still considerable room for data services to add to commercially available streaming data, Nielsen is still the leading data provider, even knowing that the data is relatively incomplete.  As we expect that advertisers will find data supplied by streamers themselves progressively less reliable, companies like iSpot (pvt), VideoAmp (pvt), and Parrot Analytics (pvt), have an opportunity to gain standing in an industry that has been dominated by a single company for many years if they can prove their data reflects the interests of advertisers more accurately, but given the lack of transparency from many streaming services, it will not be an easy task.
Picture
Picture
Picture
0 Comments

Do We Need This?

12/28/2022

0 Comments


Do We Need This?
​

While transparent displays are understandable in a retail environment, LG Display (LPL) has been working toward establishing itself as the pre-eminent supplier of transparent OLED displays and has been trying to convince parent LG Electronics (066570.KS) that this is a viable CE product for consumers.  Meetings between the display producer and parent earlier this year gave some indication that LGE was considering the idea for the 2023 TV set year but recent comments out of South Korea have indicated that no progress has been made on the idea, at least for the 2023 year, leaving it open for 2024.
Given the weakness in the CE space and the TV market overall, the idea of a new TV modality, and the costs associated with development, production, and advertising seem a bit off center, but we still have trouble with the concept itself.  Understandably, many would like not to have a massive black screen situated in a well-decorated room, and we agree, however a transparent TV, one that would look like a glass sheet, does not come without drawbacks.  In a normal OLED display, the display stack has a reflective metal cathode, so as light is generated by the emitting materials, it is reflected back and exits the display.  In transparent OLED displays, the cathode is made of a transparent material, allowing light to pass through the OLED display.  That said, each pixel in an OLED display has a driver circuit, which takes up a portion of each pixel, and while that circuitry is invisible in a transparent OLED display, it reduces the amount of light that can pass through the display.  This makes transparent OLED displays, when off, between 70% and 85% transparent relative to clear glass.  When in operation, while the display is roughly as bright as a regular OLED TV, ~38% of the image is what is behind the display, reducing the clarity of the picture.
As a display in a retail environment, such as a store window, this is not n issue as the concept is usually to add to what the viewer sees through the window, perhaps overlaying text or changing images, but still allowing the in-store merchandise to be seen.  In a residential environment, the viewer is usually interested in the best possible image, and making the above compromises for transparency reduces the quality of those images.  Chinese CE company Xiaomi (1810.HK) offered a 55” transparent TV in August 2020 based on an LG Display OLED screen for $7,200, but from what we can derive, sold very few sets and no longer offers the set on its website.
As transparent displays improve, we expect there will be more adoption in the commercial space, but we still find it unusual that LGE would consider such a product given the cost and trade-offs that consumers would have to experience.  LGD does have some slick videos about potential transparent OLED display applications, but they all fall under the commercial (signage) product line, which, in our view, is where they belong.  While we certainly commend LGD for looking to expand its transparent OLED display base, it seems a technology looking for an application in the consumer space.
Picture
Xiaomi Mi Lux Transparent TV - Source: Xiaomi
0 Comments

Panel Prices – The Year of the Black Hole

12/27/2022

0 Comments


Panel Prices – The Year of the Black Hole
​

Picture
Black Hole Imagery - Source: NASA
December
December was another wishy-washy month for LCD panel prices, with little movement in either direction, which after a few years of unusually large monthly swings, is the second month of essentially little or no change in LCD panel prices, and a positive in our view.  That is not to say we could see continued weakness in panel prices, especially given the spike in COVID cases in China as they reduce lockdown restrictions, but a bit less volatility is a good thing.  It is difficult to judge whether the lesser COVID restrictions in China will unleash some pent-up demand or whether the higher infection rate will keep that in check, but data from the 12/12 shopping holiday in China (a subset of the more well-known 11/11 shopping holiday) indicates that TV shipments were down 8.2% y/y and sales value was down 15.8% y/y for the 12/12 holiday, even with TV set ASP declining 11.5% between the 11/11 holiday and the 12/12 holiday. 
Notebooks and tablets did better than our December forecasts, pushing IT LCD (Monitor, Notebook, & Tablets) also above our forecasts, with the remaining categories within the forecasted range.  We expect relatively similar results for January, with the total LCD panel prices between -0.3% and +1.5%.  As a bargain hunting month in the US, we are modestly optimistic about overall LCD panel prices early in the 2023 year, but have already heard that one of three panel producers in Taiwan is expecting to see the company’s utilization rate increase from ~65% currently to 80% to 85% in the first quarter.  This change alone would represent a 2.5% increase in industry capacity on a m2 basis, and while we would expect capacity decreases from South Korean producers to offset some of that expected increase, we expect other producers will also take the new year as a possible ‘better world’ and increase utilization rates. 
As whatever stability the LCD panel space has seen over November and December has been driven by supply reductions rather than demand, we become more cautious when we hear that utilization is potentially increasing in the new year.  Understandably, panel producers want to have an optimistic view and are looking for a better year than 2022 in 2023, but a slow implementation of utilization reductions last year (2022) was responsible for the difficulties the LCD panel space saw during what should have been its best quarter, so hopefully the same mistake will not be repeated in reverse.  That said, panel producers are a competitive lot and do not always do what is good for the industry, so while we see a relatively flat January, we are on the alert for misplaced optimism going forward.
Picture
Picture
Aggregate Monitor Panel Pricing & ROE - 2019 - 2022 - Source: SCMR LLC, IHS, Witsview, OMDIA, RUNTO, Stone Ptrs.
Picture
Aggregate Notebook Panel Pricing & ROE - 2019 - 2022 - Source: SCMR LLC, IHS, Witsview, OMDIA, RUNTO, Stone Ptrs.
Picture
Aggregate TV Panel Pricing & ROE - 2019 - 2022 - Source: SCMR LLC, IHS, Witsview, OMDIA, RUNTO, Stone Ptrs.
Picture
Aggregate Tablet Panel Pricing & ROE - 2019 - 2022 - Source: SCMR LLC, IHS, Witsview, OMDIA, RUNTO, Stone Ptrs.
Picture
Aggregate Mobile Panel Pricing & ROE - 2019 - 2022 - Source: SCMR LLC, IHS, Witsview, OMDIA, RUNTO, Stone Ptrs
2022
Sometimes numbers speak louder than words and in the case of LCD display panel prices this year, the table below says pretty much the bulk of what needs to be said.  Other than TV panel prices, which hit 2022 lows in September, and the categories in which TV panel prices are a part (‘Large Panel’ & ‘Total’), all panel categories are at their lows for the 2022 year and for the three-year period from 2020 to 2022.  What the table does not tell is that the results are the same for the five-year period between 2018 and 2022, putting all categories, other than TV LCD panels, at their lows going back to January 2018, two years before the COVID-19 pandemic began, so the mantra of returning to pre-pandemic levels tends to soften the fact that panel prices are at lows that are in some cases, the lowest in 8 years.  
Picture
We do note that the effects of COVID have had a major influence on panel prices, both to the positive and to the negative, but the one fact that seems to override the effects of COVID is that panel production is driven by individual companies that do not work toward a common goal.  There is always the “…if they are doing it, we have to also do it…” short-term view that would seem to be a result of management looking at daily, weekly, or monthly numbers and making decisions without evaluating the near-term impact on the industry overall.  This shortsightedness seems to drag out each cycle, as the hard decisions are put off, ”…to make sure the other guy doesn’t do better than us…”, even if such decisions are detrimental to the industry.  This lack of industry coherence was quite obvious this year as many panel producers held off the utilization cuts that they knew were the only way to stem the tide of falling panel prices. 
We do note that there were other factors at play, such as high component costs, especially early in the year, and the resulting pressure to raise prices to compensate, eventually raising the specter of a global inflationary environment.  But many were predicting an end to Mr. Toad’s Wild Panel Price Ride late last year and early this year, yet panel producers continued to view the world with rose colored glasses, and have been paying the price most recently.  It would seem that either panel producers have poor economic forecasters on staff, or managements pay little attention to them, likely the latter, but the industry only seems to respond when hit repeatedly over the head.  The CE space overall is relatively poor at responding to economic indicators, so we don’t put the entire onus on panel producers as they must respond to customer requests, which can also be contrary to logic or the health of the industry, so we struggle to see a solution to the problem, which tends to be made worse by governments who support industry growth with subsidies, regardless of the consequences.  It’s a complex ecosystem that seems to find itself back in the same position every few years, albeit with a bit of CE matter being sucked into a black hole.  While black holes are among the most destructive forces in the universe, it seems most would know enough to stay as far away as possible.  JOHO
 
Picture
Aggregate Large Panel LCD Pricing - 8 Years - 2015 - 2022 - Source: SCMR LLC, IHS, OMDIA, Witsview, Stone trs. RUNTO
0 Comments

Repair

12/27/2022

0 Comments


Repair
​

We are big fans of the use of AR in applications outside of retail, and while much of the AR/VR world has been negatively painted by Meta’s (FB) haphazard spending on developing the Metaverse and the issues surrounding cryptocurrency, we note that AR is alive and well, and not waiting for the metaverse or for gamers to sing its praises.  As with all other consumer technology, the XR space is application based, with successful products filling a need, either consumer related or business related, and while VR tends to be consumer (gaming) related, AR is more oriented toward business.  There are of course, business applications for VR, where you can sit at a virtual board room table and speak with other VR enabled avatars that could be in other parts of the world, but as a practical business application, VR still has a way to go.
AR however is a less complex and more accessible technology that is able to provide information to the user without requiring isolation from the real world, and will become imbedded in a number of business segments, particularly the service industry.  By service here we mean ‘servicing’, or the repair or maintenance of equipment.  Anyone business owner or consumer who has had to call in a repair person for even the most minor issue, is aware that there is no end to the complications and costs involved. 
Home appliances are a perfect example, as when a repair is needed, almost regardless of the item, a flat fee is charged just to make the visit, with an additional hourly charge as soon as the repair person walks through the front door.  Then, there is the location of the model information, which is hopefully easily accessible, and the inevitable question of, “Do you realize how old this unit is?”, which sets the tone for expensive parts that could be in short supply.  Next comes the phone call to the office, asking about the particular potential problems that might be at cause, even before a screw is turned, with the result being, “…It could be the motor (or whatever) which is going to be a problem as they don’t make it anymore…”.  If the repair person is younger than 25, there is another call to the office to talk to the boss who explains the possible issues of said pre-digital appliance, and then more parts removed. 
When the issue is discovered there is another call to the office, this time to speak with Loretta, the keeper of the parts catalogs, to find a replacement part number, and another call to Bill’s Appliance Parts Emporium to order the replacement part, followed by the inevitable, “looks like they have to order it, so we should have it within 5 to 7 business days…”, at which point you are left with a bill for the time spent, a promise as to when the part will come in, the hope that they will call when it does, and that the same repair person will be available to install the replacement part.  When the part come in, if you are lucky the same repair person is available, although if not there will be another series of phone calls to get the situation explained and some tips on how to install the part.  Eventually your appliance gets fixed (7 to 10 days?) and you geta bill for the ‘arrival fee’, time spent, and the marked-up parts, which, in the case of a refrigerator, can cost as little as $40 and as much as $1,000 ($350 average) according to Home Advisor.
Picture
What if that appliance is not an appliance but an escalator that is the only alternative to stairs for those that are disabled in a commercial building?  Just think of that home refrigerator times 100 in terms of complexity, repair difficulty, and cost, while keeping in mind that the number of repair persons who have the specialized knowledge to fix an elevator, escalator or moving walkway is diminishing as younger workers gravitate toward more digitally oriented service jobs.  Here’s where AR comes in.  Fujitec (6406.JP), Japan’s and the world’s largest manufacturer and servicer of elevators and escalators, just signed a deal with Vuzix (VUZI) under which Fujitec will adopt the Vuzix M400 smart glasses series to support its elevator engineers (installation and repair persons), along with functioning as a training tool.
Given that the company’s products are extremely complex and therefore require years of experience to install and repair, Fujitec has been testing the AR glasses for the last few years and has now decided to deploy the glasses across the company’s service engineers.  The glasses can be used while wearing helmets, regular glasses, or gloves, and have an extended battery life.  By using the glasses, experienced engineers can guide those providing installation or repair support without travel, reducing repair cost and the need for more extensive training.  The glasses themselves are technically adaptive frames that can be used with or without eyeglasses, weigh under 3 oz. and can be mounted in a hardhat if necessary.  Based on an 8 core Qualcomm (QCOM) XR1 processor and 64GB of internal flash (6GB RAM), the glasses have 3 DOF head tracking, 3 axis gyro, accelerometer, and compass, along with and an OLED display[1] with a brightness of over 2,000 nits and 24 bit color. 
The hot swappable battery pack (2 to 12 hours) can be worn as part of the headset or a 3rd party pack can be used, while the noise cancelling microphone and integrated speakers serve as adjuncts to the 12.8 MP (4k 30 FPS) camera  with image stabilization and barcode scanner.  The glasses are wireless using Bluetooth, Wi-Fi a/b/g/n/ac and 5G connectivity, all of which means that pretty much anything you see will be seen by others at a remote location as you see it, and detailed guides and information can be superimposed over the item under repair to make diagnosis and repair a simpler task. 
The M-400 series units retail for $1,800 with a variety of accessories, although we expect Fujitec will be working under a more discounted pricing system given the company’s employee base of ~10,000.  There is no information as to the timing of the roll-out and there will likely be a relatively long learning curve for those who have not participated in the trials, but such a deal is a feather in the cap for the AR world and is a good example of applications where AR has very practical applications.  We use this as an example only and are not indicating that it ushers in the ‘era of AR’ but serves as a point along the evolutionary path of AR and its potential applications in the business world, beyond any consumer applications.  While it might seem an expensive tool currently, we expect it would pay for itself quickly in the kind of applications Fujitec would be using the device.


[1] Equivalent to a 5” mobile device at 17”
Picture
Picture
Vuzix M400 series glasses - Source: Vuzix
​Note:  We have no connection with or receive any compensation from companies mentioned herein.  All product specifications and applications are from reference sources and/or product literature.
0 Comments

5G Ecosystem – November

12/27/2022

0 Comments


5G Ecosystem – November
​

Last month we expressed some concern over the slowing rate of growth in 5G smartphones after seeing a 1.3% m/m increase in available or announced smartphones.  That trend continued in November with 5G smartphone growth registering only 0.6% m/m in November, and while still up 43.8% YTD, the last two months were the slowest growth months this year, as shown in Figure 8, with unit volume growth falling below trend line, after 5 months of above-the-line growth.  We attribute the slowdown to the overall global economic picture, particularly issues in China that have further slowed smartphone shipments.  On a more positive note, CPE devices, an indicator of 5G’s adoption in the FWA (Fixed Wireless Access) market, increased 7.0% m/m, the greatest m/m gain all year, which we see as a positive toward the use of 5G outside of mobile networks. 
We expect December will see a slight increase in the number of 5G smartphone offerings, but we expect lesser growth in 5G smartphones in 2023, a bit due to the economic conditions noted earlier, and more as the share of 5G smartphones against the total number of smartphone offerings is now over 50%.   As that share continues to rise in 2023, we expect more modest growth but will be more focused on the growth in CPE as it is imperative for 5G to become available to businesses and consumers at fixed locations.  We believe CPE device growth will be incremental data in forecasting how quickly carriers will deploy 5G as more than just a mobile transport system.  It’s expanded use in FWA will encourage carriers to build out additional service points to feed CPE demand and give 5G an additional growth path beyond mobile networks.
Picture
5G Smartphone Unit Volume & ROC - Source: SCMR LLC, GSA.com
Picture
5G Ecosystem - Primary Indicators - Source: SCMR LLC, GSA.com
Picture
Selected 5G Devices - Device Offerings - Source: SCMR LLC, GMSA
Picture
5G Smartphone Offerings - Share of Total - 2019 - 2022 YTD - Source: SCMR LLC, GSMArena
0 Comments

…And…

12/21/2022

0 Comments


…And…
​

AP Systems (aka APS Holdings) has announced that they have been able to create an OLEDoS (OLED on Silicon) display with a resolution of 3,000 PPI, after reaching the 1,000 PPI mark earlier this year.  While such resolutions have been reached using OLED and color filter systems (see above), APS accomplished this resolution using RGB patterning and no color filter.   An APS subsidiary was responsible for the deposition and encapsulation, which was done with a FMM (Fine Metal Mask) that is placed over the substrate during OLED material deposition.  The small holes in the mask direct the OLED material pattern, although typical masks have been unable to gain this level of refinement as the smaller the patterning holes get, the more the mask can flex, leading to misplaced materials, and making the mask thicker allows for OLED materials to collect more quickly on the mask and the thicker hole sidewalls create ‘shadows’ that also misalign materials.
APS creates its masks using a laser to create the mesh, while typical masks are produced using etchants.  APS has championed the laser mask process over the etch process during a government funding bake-off and seems to have been successful, as its current mask for the 3,000 PPI display is 8um thick, while masks used in generic smartphones are 18um, with both being made of the same iron-nickel alloy.  While there are still production issues when working at such higher resolutions, APS seems to be going in a direction that will move the AR/VR display hardware side more rapidly ahead, and given its relationship with Samsung Display, we expect they will play an additional role in SDC’s AR/VR display project mentioned above.
Picture
FMM Shadow Issue - Source: SCMR LLC
0 Comments

Samsung XR

12/21/2022

0 Comments


Samsung XR
​

As we mentioned in our12-05-22 note, Samsung Electronics (005930.KS) has been conspicuously absent from the AR/VR world and seems to be looking toward the necessity for an application that would drive consumers into the space before making a major step into the AR/VR hardware business.  That said, Samsung has been developing and to a lesser degree marketing, Micro-LED technology, which is the use of very small LEDs as display emitting sources.  While Micro-LED technology is thought to be the ultimate replacement for LCD and even OLED display technology years down the road, it is currently a work in progress, and still faces some major issues that limit its use and maintain a high cost.  While that development will continue, Samsung Display (pvt) is taking its expertise in OLED display technology and moving toward another display venue.
SDC is beginning to take steps toward the mass production of Micro-OLED displays.  Micro-OLED displays use existing OLED technology, that of phosphorescent and fluorescent emitter materials, but with unusually small pixels that are densely packed in a small space..  There are theoretically two ways in which Micro-OLEDs can be used, the first being with an OLED emitter (or combination of emitters) that produces a single color and is then passed through a color filter that breaks the light into red, green, and blue components, similar to the way and OLED TV works.  The second is a using three OLED emitters (RGB) that are individually controllable and therefore do not need a color filter, similar to the way a smartphone OLED display works.  What makes these displays different from typical OLED displays is that they are built on silicon substrates, where larger OLED displays tend to be built on glass or flexible polymer plastics.
The OLED/Color filter path for Micro-OLED is being championed by Sony (SNE), who produces such displays for camera electronic viewer, HUDs, and AR/VR devices.  The display shown below measures 0.64” (Diagonal) and has 3,145,728 pixels squeezed into a display that is 0.512” x 0.384”, representing ~4,000 pixels/inch, with each pixel being spaced 0.0064mm apart (on center).  While this might sound like overkill, in a VR application the display is almost touching your eye, so if the pixels were not so closely spaced, the user would see gaps between the pixels, creating what is called the ‘screen-door’ effect
Picture
Sony ECX342A - Micro-OLED Display - Source: Sony
The problem is however, that using a color filter to create colors means that much of the light energy is eliminated, either reflected away from the user or absorbed, reducing the overall brightness of each color and the overall display, so Samsung Display, the global leader in RGB OLED displays for smartphones, is looking toward creating RGB Micro-OL:ED displays that contain a red, green, and blue sub-pixel within each pixel, and therefore does not need a color filter.  As can be expected however, these sub-pixels must all fit within the space of a pixel, which makes their deposition even more difficult and precise than that of the OLED/Color filter process.  It seems that while Samsung Electronics is still trying to find a key that will unlock consumer interest in AR/VR, Samsung Display, an affiliate, is thought to be taking the Micro-OLED concept a bit further.  
Picture
​Samsung Display is said to be developing a Micro-LED pilot line at its A2 display fab in Asan, Korea.  According to local sources, the company has ordered panel logistics systems from SFA (036540.KS) and glass encapsulation tools from AP Systems (054620.KS) for the pilot line that is expected to go into limited production toward the middle of 2023.  If successful, SDC will allocate funding for the construction of a small mass production line in 2024 that would be built to handle 6,400 sheets/month at the onset.  While we do not yet know the details of the intended product line, we expect the ultimate objective is to produce an RGB Micro-OLED display that will be used in commercial AR/VR applications, likely by Samsung itself, or sold to other customers, and with Apple (AAPL) expected to release an AR/VR device in 2023 or 2024, SDC is looking to develop a high volume mass production line that will feed the Apple AR/VR supply chain, especially given that Sony is expected to be the supplier for the initial Apple AR/VR product.
We note that creating OLED Micro-displays using the OLED/CF process is difficult, but the process of placing three separate OLED emitters in each pixel makes the RGB Micro-OLED process even more difficult, and SDC will face a number of challenges for which it must find solutions that can be scaled to mass production if these displays are ever to be within the cost demands of high volume consumer devices.  There are only a few manufacturers that can produce OLED Micro-displays, a number of which are large enough to be recognized by investors, such as China’s BOE (200725.CH), E-Magin (EMAN) and Sony, however others are far less recognizable, especially those based in China, such as SeeYa (pvt) in Hefei, Sidtek (pvt) in Wuhu City, Olightek (pvt) in Kunming, and Microoled (pvt) in Grenoble, all of whom have at least some product in the market. 
That said, this is still an evolving product segment and is driven on the technology side by higher resolution, higher brightness near-eye display improvements, leading to headsets and devices that are less bulky and cause less fatigue and stress.  But while the near-eye display industry continues to develop, and the two biggest CE players have not yet participated, the need for application driven demand is the industry’s major growth stumbling block.  Gaming is certainly a driver for the VR space and continues to evolve, but the metaphor of the ‘metaverse’, Meta’s (FB) hope for the future, is not enough to drive the high volumes needed for major CE companies to enter the market.  Meta has been on a costly quest to convince the world that the metaverse is other than a way to sell you something and collect user information but lacks a real application driver to attract consumers.  We expect the technology side of AR/VR displays to develop more rapidly in 2023 and 2024 but the application space will be the true driver for pushing AR/VR more quickly into the CE space.  Without application drivers, we expect the overall development of AR/VR to progress relatively slowly, likely falling behind expectations.
0 Comments

Semiconductor Capacity Construction Costs

12/20/2022

0 Comments


Semiconductor Capacity Construction Costs
​

​Samsung Electronics (005930.KS) announced it would build a new semiconductor fab in June of 2020, relatively soon after it completed construction of its P2 fab in Pyeongtaek, South Korea.  The P3 fab was to start construction in September 2020 and was to begin operation in late 2021 or early 2022, the 3rd plant at this site, and a bit larger (~75%) than P2.  The fab was originally thought to be focused on DRAM and NAND production and was to feature the latest production technology that is available to the company, logically, EUV, and would add to Samsung’s dominance of the memory market.  Back in May of this year it was indicated that Samsung would begin to place orders and install equipment at the fab and complete construction by the 2nd half of the year.
The fab is expected to cost between $23.35b and $31.14b over the next few years as the fab is fully built out, and the company has enough land at the site to build three additional fabs (P4 – P6) with a combination of NAND, DRAM, and foundry capacity going forward, however it seems Samsung is facing the same inflationary cost increases that we as consumers have been facing, despite the fact that Samsung affiliates are some of the major suppliers to the project.  Samsung C&T (028260.KS) has increased its contract price by 34.4% against the original contract,  Samsung Engineering (028050.KS) has raised its contract price by 40.0% and Samsung Heavy Industries (010140.KS) has raised its contract price by 24.1%, putting the increase for just these three affiliates up by 35.1% in aggregate, or an additional $778.5m US, with all three citing increases in raw materials and labor costs as the reason behind the increases.
While the construction and the equipment installation continues, some of the ongoing contracts have been pushed out by as much as a year, which we expect means that Samsung is focusing on finishing specific P3 projects and delaying the build-out of others in this large fab.  Intel (INTC) is also facing a similar situation as it plans out its new fab in Magdeburg, Germany, as the cost has risen from 18.07b US to 21.26b US, a 17.65% increase, with the company indicating that it has delayed the start of construction for the project, which was to begin in the 1st half of 2023, even with the $7.23b promised by the German government toward the project.
While none of this is good for the global economy, it does have one positive outcome, and that is to slow the capacity increases that have been planned for the semiconductor space, which we expect would cause an over-supply situation  in 2024 and 2025.  While the delays will inevitably move back into the queue as overall consumer demand begins to stabilize, at least the build-outs will be a bit more staggered, although China is still a wild card that will likely see less semiconductor planning changes as the battle with the US government over semiconductor equipment continues.  China has little choice but to build capacity as it sees both external supply and demand decrease.  While China might not be able to build advanced node capacity, they can add more mature nodes for internal consumption and wait until the global climate is ready to allow them back, at which point we expect they will dominate the generic  semiconductor space, as they have done in both the LED and display industries.
Picture
NAND Flash Revenue Share - 2019 - 2022 YTD - Source: SCMR LLC, Trendforce
0 Comments

Huawei Wins in Court

12/20/2022

0 Comments


Huawei Wins in Court
​

​Huawei (pvt), once the country’s leading smartphone and telecommunications brand, has won a court battle over the counterfeiting of one of its products.  We note that Huawei was some powerful back a few years ago that the Chairman said it did not have the time to sue others for copyright infringement, as it was far too busy producing and selling product.  It seems things have cooled enough that the company takes its IP a bit more seriously these days, and after documenting that two competitors were advertising their earbud products as “Huawei Universal” and “Official Original Authentic Product” on a number of retail sites, and were selling these knock-offs for $0.90 against the Huawei price of $1.81, Huawei took them to court.
All totaled, before the items were removed from store shelves, ~$584,000 worth of these counterfeit items were sold, with the court agreeing with Huawei that the use of the word “Huawei’ in the advertisements would be enough to make consumers think they were getting actual Huawei products, awarding the company $57,459 in compensation, paid by the defendants.  That said, after it was revealed that the defendants had been it court before for infringing Huawei’s logos and trademarks, the court ordered an additional $143,647 to be paid to Huawei, who seems to have the time to litigate such matters these days.
0 Comments
<<Previous

    Author

    We publish daily notes to clients.  We archive selected notes here, please contact us at: ​[email protected] for detail or subscription information.

    Archives

    May 2025
    April 2025
    March 2025
    February 2025
    January 2025
    January 2024
    November 2023
    October 2023
    September 2023
    August 2023
    June 2023
    May 2023
    February 2023
    January 2023
    December 2022
    November 2022
    October 2022
    September 2022
    August 2022
    July 2022
    June 2022
    May 2022
    April 2022
    March 2022
    February 2022
    January 2022
    December 2021
    November 2021
    October 2021
    September 2021
    August 2021
    July 2021
    June 2021
    May 2021
    April 2021
    March 2021
    February 2021
    January 2021
    December 2020
    October 2020
    July 2020
    May 2020
    November 2019
    April 2019
    January 2019
    January 2018
    August 2017
    July 2017
    June 2017
    May 2017
    April 2017
    March 2017
    February 2017
    January 2017
    November 2016
    October 2016
    September 2016

    Categories

    All
    5G
    8K
    Aapl
    AI
    AMZN
    AR
    ASML
    Audio
    AUO
    Autonomous Engineering
    Bixby
    Boe
    China Consumer Electronics
    China - Consumer Electronics
    Chinastar
    Chromebooks
    Components
    Connected Home
    Consumer Electronics General
    Consumer Electronics - General
    Corning
    COVID
    Crypto
    Deepfake
    Deepseek
    Display Panels
    DLB
    E-Ink
    E Paper
    E-paper
    Facebook
    Facial Recognition
    Foldables
    Foxconn
    Free Space Optical Communication
    Global Foundries
    GOOG
    Hacking
    Hannstar
    Headphones
    Hisense
    HKC
    Huawei
    Idemitsu Kosan
    Igzo
    Ink Jet Printing
    Innolux
    Japan Display
    JOLED
    LEDs
    Lg Display
    Lg Electronics
    LG Innotek
    LIDAR
    Matter
    Mediatek
    Meta
    Metaverse
    Micro LED
    Micro-LED
    Micro-OLED
    Mini LED
    Misc.
    MmWave
    Monitors
    Nanosys
    NFT
    Notebooks
    Oled
    OpenAI
    QCOM
    QD/OLED
    Quantum Dots
    RFID
    Robotics
    Royole
    Samsung
    Samsung Display
    Samsung Electronics
    Sanan
    Semiconductors
    Sensors
    Sharp
    Shipping
    Smartphones
    Smart Stuff
    SNE
    Software
    Tariffs
    TCL
    Thaad
    Tianma
    TikTok
    TSM
    TV
    Universal Display
    Visionox
    VR
    Wearables
    Xiaomi

    RSS Feed

Site powered by Weebly. Managed by Bluehost