Oy Vega!
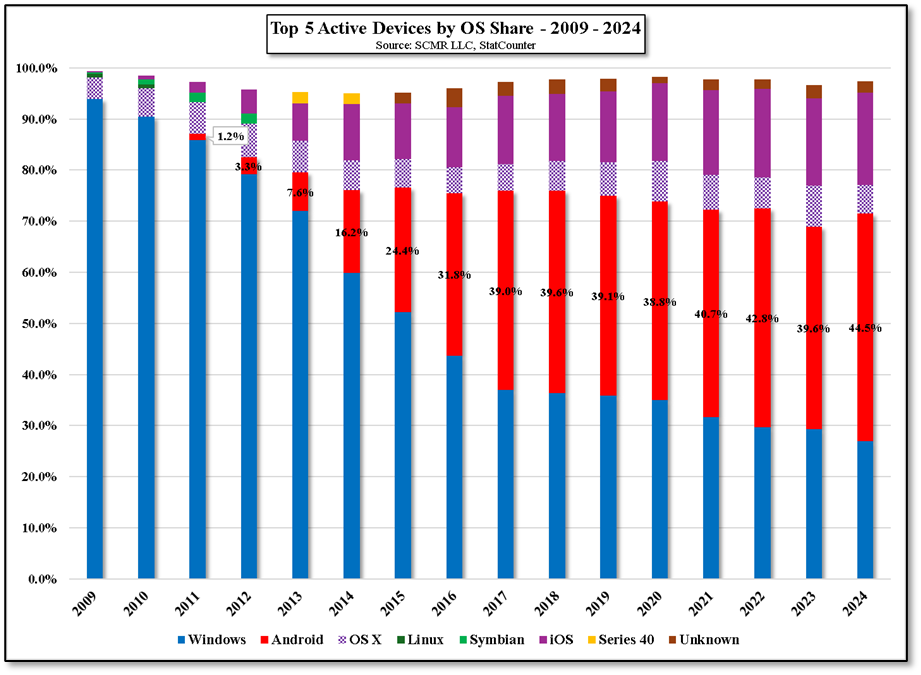
Way back in 2008, HTC (2498.TT) released the Dream smartphone, the first to use the Android OS, competing with Symbian, owned by Nokia (NOKIA.FI) (49.8% share) and Blackberry OS, owned by RIM (BB), with a 16.6% share. Within 3 years Android became the OS with the largest share and has maintained that position since[1]. The ability to maintain such leadership is based on the fact that the Android kernel is open-source and can therefore be downloaded and modified with paying Google (GOOG). However there are many Google apps that run under Android (Google Maps, Gmail, Google Playstore, etc.) that have to be licensed.
Because Android is so popular, it is surprising that any company would undertake a project to develop a proprietary OS. Estimates range from 5 to 10 years to develop the kernel and components for a large team of skilled engineers, with specialties in embedded systems, security, and assembly language. Cost estimates range from ~$1b to over $10b, with the user interface alone running close to $100m. This prices out most companies, but instead of developing a proprietary OS from scratch, companies can modify the Android or Linux kernel in order to create an OS that they believe is best suited to their products and affords some differentiation.
That is exactly what Amazon (AMZN) is thought to be doing. While the Vega OS is based on the Linux kernel, it is being built from the ground up, allowing it to be highly customized to Amazon hardware, similar to the way Samsung’s Tizen OS is based around Linux rather than Android. As noted below, the control Amazon gains, including a modern user interface and potentially deep AI integration, is likely far more so than could be achieved through continued Android development, but it takes considerable time to build an application development ecosystem, with no guarantee that it will be successful. Samsung has been successful with Tizen in the smart TV space, but as the leader in that genre, it has a distinct advantage, although its applications are still a bit limited, even after almost 10 years of development.
Amazon will have to bear the continued development cost and maintenance of the Vega OS system and find ways to encourage developers to hop on board once the OS is officially released (expected some time this year), all of which can be an albatross if little momentum is developed. It’s a high risk, high reward game that only a few players could afford to play, but Amazon does have over 500m Alexa devices in operation, over 200m streaming sticks, e-readers, home security systems, and lots of smart speakers to eventually connect through Vega OS, so at the least, they have at least a shot over the next few years to gain enough share to make it into the top 5.
[1] Note that in terms of active device share, that crossover did note occur until 2017.


 RSS Feed