The New Display Geometry: HKC’s 8.5 Billion Yuan Gambit
IPO Overview and Fab Infrastructure
HKC (pvt) received final approval from the Shenzhen Stock Exchange for an IPO in which the company is expected to raise 8.5 billion yuan ($1.238 billion US). HKC is China’s 3rd largest display producer (13.4% share of China) behind BOE (200725.CH) and Chinastar (pvt), generating between $350 million and $500 million (US) on a monthly basis (2025). HKC currently runs four fabs, all of which are Gen 8.6, with a total capacity of 350,000 sheets/month.
The IGZO Pivot: Bridging to IT and OLED
The IPO also funds (30% of proceeds) HKC’s eLEAP Photolithographic OLED production process with an OLED R&D Development Center and an upgrade of the company’s OLED pilot line at the Changsha fab. While the R&D Center will continue the company’s OLED development, the funding will move the pilot line closer to commercial scale, in order to prove out the eLEAP technology in a mass production setting. We note that eLEAP OLED technology is a proprietary technology that has been licensed from Japan Display (6740.JP). At one point HKC was exploring a partnership with Japan Display to develop, commercialize, and build an eLEAP OLED fab, however that relationship fizzled when JDI insisted on high licensing fees. Instead, HKC acquired some of JDI’s Gen 6 equipment when JDI closed its Mobara fab and receives technical support from JDI, but license the eLEAP technology and is building out the more advanced pilot line independently.
The eLEAP Shortcut: Skipping the Development Cycle
The distinction here is important as HKC, by licensing this technology, skips a large chunk of the development cycle and potentially shortens the time it will take for them to directly compete with SDC and BOE in the Gen 8.6 OLED IT space. That said, this is still unproven technology, and while it shows promise at the pilot line level, taking it to mass production is another ball game. SDC and BOE have spent years developing their Gen 8.6 OLED IT production technology and we expect HKC’s path to a competitive product will take some time. HKC will be using JDI’s equipment and technology for a Gen 6 line as a precursor to an actual Gen 8.6 OLED fab, which indicates that the time to HKC’s Gen 8.6 IT OLED mass production is still years out.
We note also that the cost of HKC’s eLEAP buildout has already been accruing. HKC paid JDI a fixed technology transfer fee estimated to be between $150 million and $200 million, but JDI has used its largest and controlling shareholder (Ichigo Trust) to hide the actual amount from investors. The royalty payment goes to JDI’s parent (who actually owns the IP) and will be based on area (fixed fee) and price percentage. This keeps Japan Display from losing out should HKC lower prices to gain share.
Near-Term Revenue: Mini-LED and Next-Gen Backlighting
The third leg of the IPO is a bit more direct and is meant to generate nearer-term revenue while the other projects are expected to deliver in the future. In concert with the 2 billion yuan IPO funds for this project, HKC is also funding an 8 billion yuan (10 billion yuan or $1.456 billion US total) project to develop the production of Mini-LED backlight modules. This includes COB (Chip-on-board) processes to increase the number of dimming zones and will also produce Direct view Micro-LED tiles.
The company recently released the HKC M10 Ultra monitor which is based on RGB Mini-LED technology. Typical Mini-LED displays use all blue LEDs with a quantum dot conversion film to create RGB colors. In this case, the backlight provides the color but on a broader scale, not on a sub-pixel basis. This means that the color filter that used to be the sub-pixel color source is now an ‘enhancer’ making the sub-pixel colors more precise. This allows less ‘filtering’ and a brighter display, albeit at a higher cost.
The 21 Billion Yuan Question: Financial and Yield Constraints
As the transition that HKC is attempting to make from a commodity LCD panel producer to a premium OLED product producer is a tricky one to say the least, the risks associated with the IPO are substantial. HKC is currently carrying 21 billion yuan in short-term debt and has a Debt/Asset ratio of almost 69% which might make some concerned as to the true motivation behind the IPO. In terms of operational risk, a more standard approach to Gen 8.6 IT OLED, such as the one taken by both Samsung Display and BOE, might reduce that risk but the company has chosen to use an untested (in mass production) technology which could lead to an extended period of low yields.
The V-Stripe Factor: IP Litigation and Sub-Pixel Clarity
HKC also has another risk that could come into play at a later date. While it seems less than important to the average user, the layout of sub-pixels on displays, is a big deal. The diamond sub-pixel pattern that is typical in many OLED displays is ideal for video reproduction, however it is less so for text and has been known to cause jagged edges or blurring on some displays. Over the years various brands attempted to change the pattern to reduce or eliminate the text distortion. Sony (SNE) accomplished the task in their video production monitors but a price above $25,000 for a 17” monitor kept it out of commercial production. JOLED (defunct) did it as part of their inkjet printing system and more recently Samsung Display (pvt) did it with their V-Stripe layout for their QD/OLED displays. HKC, as part of the Japan Display technology, also uses a V-stripe layout that differs slightly from Samsung’s, but should Samsung Display decide to litigate the V-Stripe IP, particularly the processes required to place the sub-pixels in that configuration and win, HKC’s entire OLED R&D, development, and licensing program would be in jeopardy.
HKC (pvt) received final approval from the Shenzhen Stock Exchange for an IPO in which the company is expected to raise 8.5 billion yuan ($1.238 billion US). HKC is China’s 3rd largest display producer (13.4% share of China) behind BOE (200725.CH) and Chinastar (pvt), generating between $350 million and $500 million (US) on a monthly basis (2025). HKC currently runs four fabs, all of which are Gen 8.6, with a total capacity of 350,000 sheets/month.
- H1 - Chongqing
- H2 - Huzhou
- H4 - Mianyang
- H5 - Changsha
The IGZO Pivot: Bridging to IT and OLED
The IPO also funds (30% of proceeds) HKC’s eLEAP Photolithographic OLED production process with an OLED R&D Development Center and an upgrade of the company’s OLED pilot line at the Changsha fab. While the R&D Center will continue the company’s OLED development, the funding will move the pilot line closer to commercial scale, in order to prove out the eLEAP technology in a mass production setting. We note that eLEAP OLED technology is a proprietary technology that has been licensed from Japan Display (6740.JP). At one point HKC was exploring a partnership with Japan Display to develop, commercialize, and build an eLEAP OLED fab, however that relationship fizzled when JDI insisted on high licensing fees. Instead, HKC acquired some of JDI’s Gen 6 equipment when JDI closed its Mobara fab and receives technical support from JDI, but license the eLEAP technology and is building out the more advanced pilot line independently.
The eLEAP Shortcut: Skipping the Development Cycle
The distinction here is important as HKC, by licensing this technology, skips a large chunk of the development cycle and potentially shortens the time it will take for them to directly compete with SDC and BOE in the Gen 8.6 OLED IT space. That said, this is still unproven technology, and while it shows promise at the pilot line level, taking it to mass production is another ball game. SDC and BOE have spent years developing their Gen 8.6 OLED IT production technology and we expect HKC’s path to a competitive product will take some time. HKC will be using JDI’s equipment and technology for a Gen 6 line as a precursor to an actual Gen 8.6 OLED fab, which indicates that the time to HKC’s Gen 8.6 IT OLED mass production is still years out.
We note also that the cost of HKC’s eLEAP buildout has already been accruing. HKC paid JDI a fixed technology transfer fee estimated to be between $150 million and $200 million, but JDI has used its largest and controlling shareholder (Ichigo Trust) to hide the actual amount from investors. The royalty payment goes to JDI’s parent (who actually owns the IP) and will be based on area (fixed fee) and price percentage. This keeps Japan Display from losing out should HKC lower prices to gain share.
Near-Term Revenue: Mini-LED and Next-Gen Backlighting
The third leg of the IPO is a bit more direct and is meant to generate nearer-term revenue while the other projects are expected to deliver in the future. In concert with the 2 billion yuan IPO funds for this project, HKC is also funding an 8 billion yuan (10 billion yuan or $1.456 billion US total) project to develop the production of Mini-LED backlight modules. This includes COB (Chip-on-board) processes to increase the number of dimming zones and will also produce Direct view Micro-LED tiles.
The company recently released the HKC M10 Ultra monitor which is based on RGB Mini-LED technology. Typical Mini-LED displays use all blue LEDs with a quantum dot conversion film to create RGB colors. In this case, the backlight provides the color but on a broader scale, not on a sub-pixel basis. This means that the color filter that used to be the sub-pixel color source is now an ‘enhancer’ making the sub-pixel colors more precise. This allows less ‘filtering’ and a brighter display, albeit at a higher cost.
The 21 Billion Yuan Question: Financial and Yield Constraints
As the transition that HKC is attempting to make from a commodity LCD panel producer to a premium OLED product producer is a tricky one to say the least, the risks associated with the IPO are substantial. HKC is currently carrying 21 billion yuan in short-term debt and has a Debt/Asset ratio of almost 69% which might make some concerned as to the true motivation behind the IPO. In terms of operational risk, a more standard approach to Gen 8.6 IT OLED, such as the one taken by both Samsung Display and BOE, might reduce that risk but the company has chosen to use an untested (in mass production) technology which could lead to an extended period of low yields.
The V-Stripe Factor: IP Litigation and Sub-Pixel Clarity
HKC also has another risk that could come into play at a later date. While it seems less than important to the average user, the layout of sub-pixels on displays, is a big deal. The diamond sub-pixel pattern that is typical in many OLED displays is ideal for video reproduction, however it is less so for text and has been known to cause jagged edges or blurring on some displays. Over the years various brands attempted to change the pattern to reduce or eliminate the text distortion. Sony (SNE) accomplished the task in their video production monitors but a price above $25,000 for a 17” monitor kept it out of commercial production. JOLED (defunct) did it as part of their inkjet printing system and more recently Samsung Display (pvt) did it with their V-Stripe layout for their QD/OLED displays. HKC, as part of the Japan Display technology, also uses a V-stripe layout that differs slightly from Samsung’s, but should Samsung Display decide to litigate the V-Stripe IP, particularly the processes required to place the sub-pixels in that configuration and win, HKC’s entire OLED R&D, development, and licensing program would be in jeopardy.
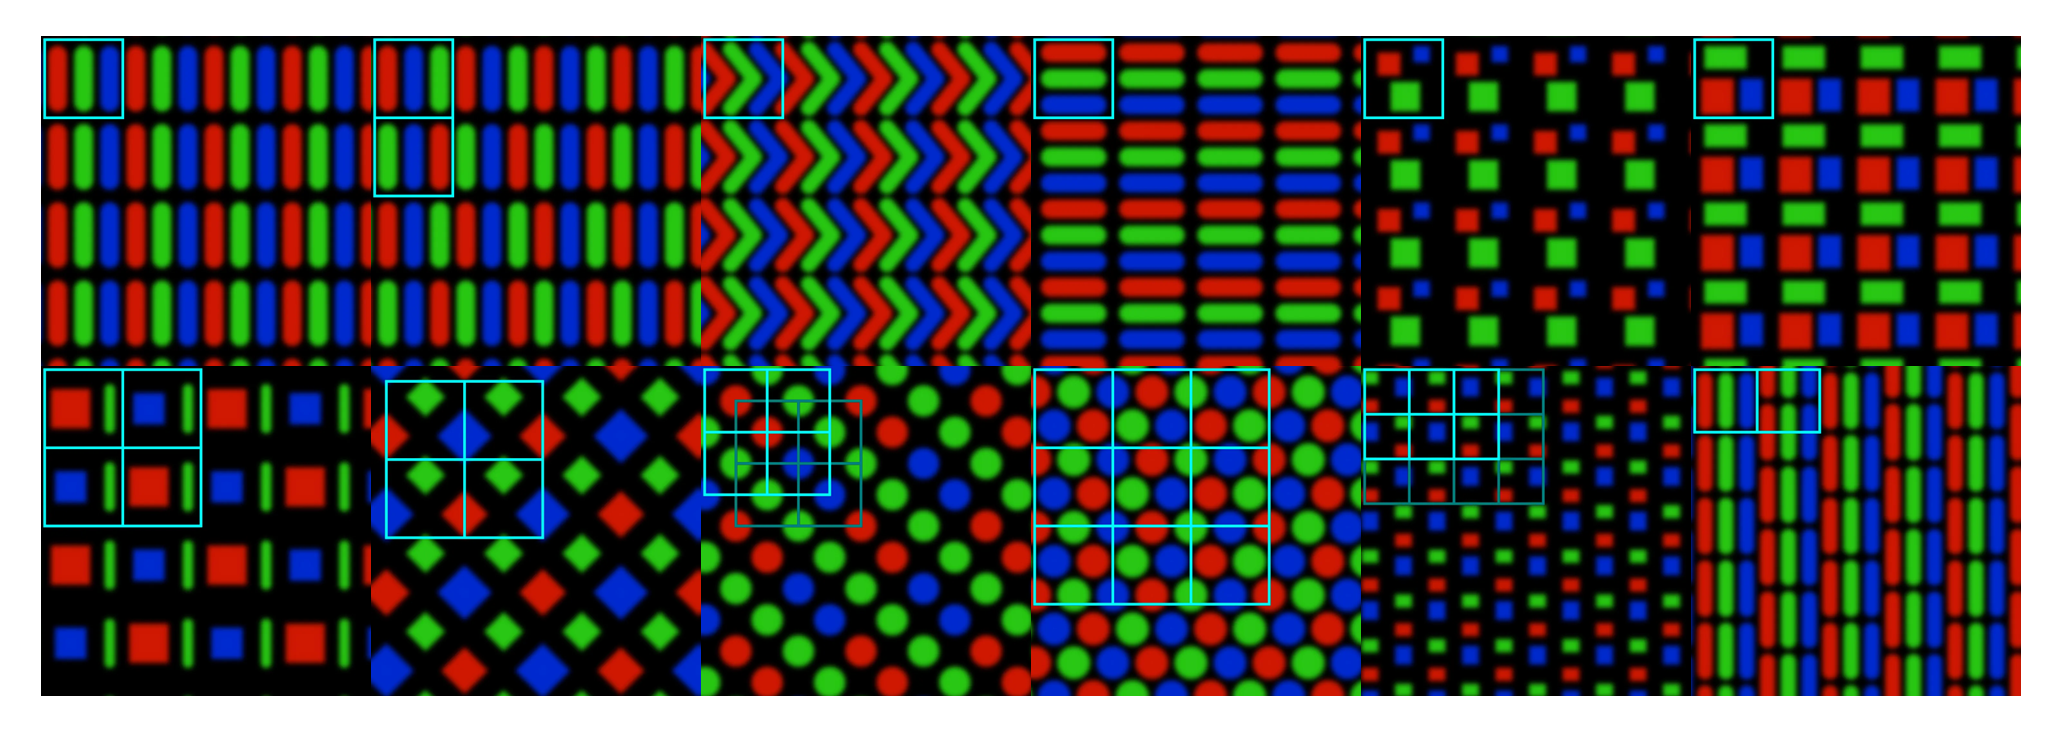
Figure 1 - Assorted OLED Sub-pixel patterns used in high resolution displays - Source: SCMR-LLC, geometrian.com
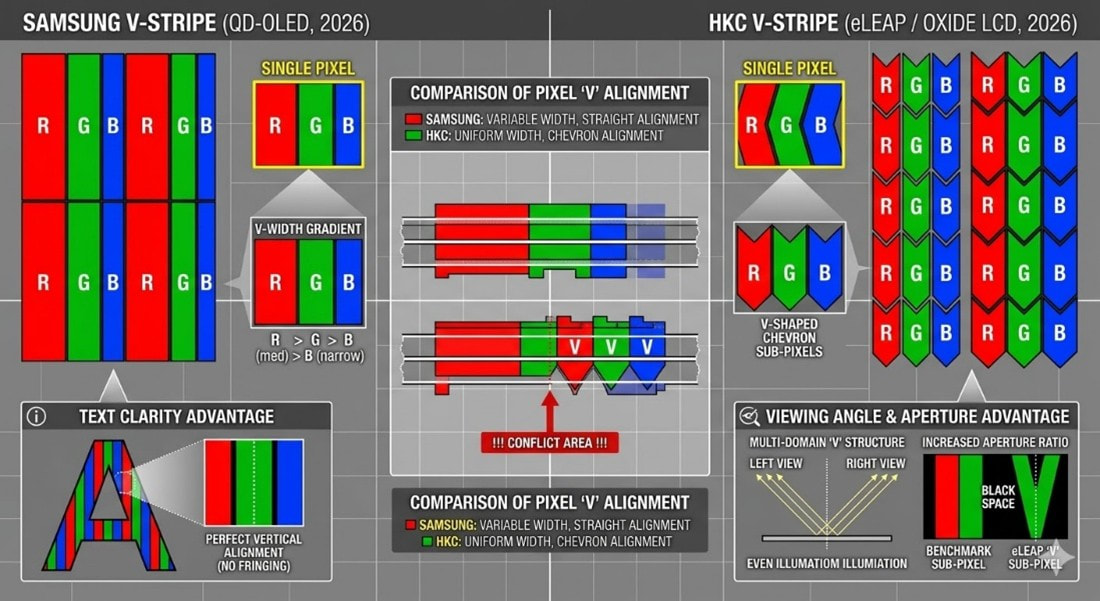
Figure 2 - V-Stripe Layout Comparison - Source: SCMR-LLC, Nano-banana
The India Strategy: The Dixon JV and Regulatory Tailwinds
HKC does have an additional card to play. They just received final approval for a JV between the company and Dixon (540699.IN), India’s largest in-country EMS. Dixon assembles for a variety of primarily Android and Domestic IT firms in India, and in that space has a ~45% market share, They also compete (small share) against multi-nationals like Foxconn (2354.TT), Pegatron (4938.TT), and Wistron/Tata (pvt) in the iPhone ecosystem but have had little to offer that their competitors cannot match. HKC will have an outlet for their IT products in Dixon, who can offer customers discounted packages if the opt for HKC displays, benefiting both HKC and Dixon. But while the Android market is ripe for the JV, Dixon is at the early stages of becoming an approved component vendor for Apple (AAPL), which means that potential incremental market is still years away. That said, the Indian government recently increased the incentive outlay for components, giving the JV additional incentive to build its component supply business.
Conclusion: The eLEAP Gambit
HKC stands at a critical strategic inflection point. By moving away from the "commodity trap" of Gen 8.6 a-Si TV panels and aggressively funding the IGZO and eLEAP OLED transitions, the company is attempting to rewrite its identity as a Tier 1 technology innovator. However, the path to 2027 is paved with significant execution risks. While the licensing of JDI’s eLEAP technology provides a theoretical shortcut to competing with Samsung and BOE, the transition from a pilot line to Gen 8.6 mass production, without the safety net of a major South Korean partner, is a feat rarely achieved in this industry.
Furthermore, the company’s high debt-to-asset ratio (69%) leaves little room for the yield-loss "learning curve" typical of new photolithographic processes. The "wild card" in this narrative is the Dixon JV in India, which finally cleared its major regulatory hurdle on March 10, 2026. This 74:26 partnership provides HKC with a secured, high-utilization outlet for its IT modules in a rapidly expanding market. If HKC can successfully leverage this "Make in India" bridge to generate near-term cash flow while its OLED technology matures, it may just pull off one of the most ambitious technological leapfrogs in recent display history. For investors, the HKC IPO is not just a bet on a display manufacturer; it is a bet on whether licensed Japanese IP can successfully break the Korean stranglehold on the high-margin IT display ecosystem.


 RSS Feed