The Velocity of Hardware: Inside Samsung’s Radical Defense of the Premium TV Market
The Premium Battleground: Margin Squeezes and Upmarket Shifts
The TV set market is among the most competitive in the Consumer Electronics space, with over a dozen brands maintaining a market share over 1%. That said, almost 50% of the market is controlled by the top three TV set brands, Samsung Electronics (005930.KS), TCL (000100.CH), and Hisense (600060.CH), with Samsung remaining the dominant brand for the last 20 years. Both Chinese brands became successful both in China and then globally, by offering lower priced sets that have features similar to higher priced brands originally achieved immense success, first domestically and then globally by offering lower-priced sets featuring specifications similar to higher priced legacy rivals. This tactic was an effective while the Chinese economy was in high growth mode, but slower domestic growth in China combined with a relatively stagnant global TV market has continued to squeeze brand margins across the board.
While Chinese brands ruled the lower-priced tiers, Samsung has dominated the premium TV set category, where it faces less intense competition from Chinese brands. However, over the last few years, driven by local market saturation and margin compression, Chinese manufacturers have aggressively moved up the value chain to capture a slice of this high-margin premium territory.
The OLED Misstep vs. The Mini-LED Leverage Strategy
China was late to embrace the true potential of OLED displays, a strategic mistake that allowed South Korean panel producers to rule the large-format space for years. The root of this error lay in state infrastructure planning: the Chinese government had heavily subsidized the massive build-out of legacy LCD manufacturing infrastructure. To protect the production value of those massive state assets. A disruptive technology like OLED was initially suppressed because it threatened to devalue existing LCD resources
That said, Chinese panel producers did not make that mistake when it came to more recent mini-LED technology because Mini-LED is a direct architectural outgrowth of LCD—improving the backlight array rather than replacing the panel entirely. Mini-LED technology was rapidly adopted by large Chinese panel manufacturers who weaponized it as a defensive moat against encroaching OLED market share. By adapting existing LCD backlight lines without incurring the multi-billion-dollar capital expenditure of building fresh OLED fabs from scratch, Chinese producers rapidly matured their processes. This gave them a high-performing entry ticket into the premium TV market without devaluing their core LCD infrastructure, allowing them to develop large-panel OLED capabilities at a much slower, less risky pace.
Squeezing the Leader: TCL Overtakes Samsung in Shipped Units
Consequently, while South Korean firms remain the sole suppliers of large-panel TV OLEDs, China has successfully scaled its local small-panel OLED supply. On the other side of the equation, Samsung has become the largest Mini-LED TV supplier, despite the fact that they do not produce any LCD TV panels themselves. They have used Mini-LED TV to expand their premium TV offerings and fill in gaps in their high-end TV set lines consisting of OLED and ultra-premium Micro-LED lines.
Samsung, in typical brand fashion, makes improvements in technology each yearly cycle, adding features to stay one step ahead of the competition. However, they have found that Chinese brands are closing the feature gap rapidly, keeping intense pricing pressure on Samsung’s premium tiers. This year Samsung has taken a more radical approach and made substantial changes to its TV product line structure to offset incursions by Chinese brands. We note that in the month of December last year TCL surpassed Samsung in terms of Mini-LED units shipping at a 16% share rate to Samsung’s 13%. Below, we break down the structural evolution from the 2025 lineup to the newly overhauled 2026 strategy designed to neutralize TCL and Hisense.
Retrospective: Inconsistencies in the 2025 Samsung Premium Lineup
In 2025 Samsung’s premium Mini-LED TV set line was bifurcated into an 8K segment and a 4K segment, both of which consisted of Mini-LED TV sets with Quantum Dot enhancement. There were no sets with only Quantum Dots last year, which in previous years had made up the lowest price tier of the premium line The 8K line consisted of two price tiers, while the 4K line consisted of 4 price tiers.

As the data shows, the 2025 product architecture suffered from clear operational friction, particularly in the 4K mid-price tiers where MSRP bands overlapped heavily. While underlying features did vary by tier, the subtlety of those hardware changes was effectively invisible to the average consumer, whose purchasing criteria remains strictly ordered by price, then size. Last year Samsung also eliminated the line of Quantum Dot (No Mini-LED) TVs that represented the lowest tier of the premium set line in previous years.
Note: In this note we discuss only Samsung’s Mini and Micro-LED TV set products. Samsung’s OLED TV sets will be covered in a separate note.
The 2026 Structural Pivot: Streamlining the Technology Matrix
To clean up consumer confusion and protect value capture, Samsung’s 2026 strategy redefines the premium tier into four highly distinct technology categories.
- Micro-RGB – (14 models) While Samsung previewed this technology with one model last year, Samsung has expanded this technology to 15 models and made it the crown jewel of the premium TV set line.
- Mini-LED – (23 Models) In terms of premium TV set unit volume, Mini-LED TVs are Samsung’s largest category. This tear it is broken down into three categories. A single 98” 8K Mini-LED set with Quantum Dots, two categories of 4K Mini-LED TVs with Quantum Dots, and two categories of 4K Mini-LED Tvs without Quantum Dots, with the latter the lower priced category.
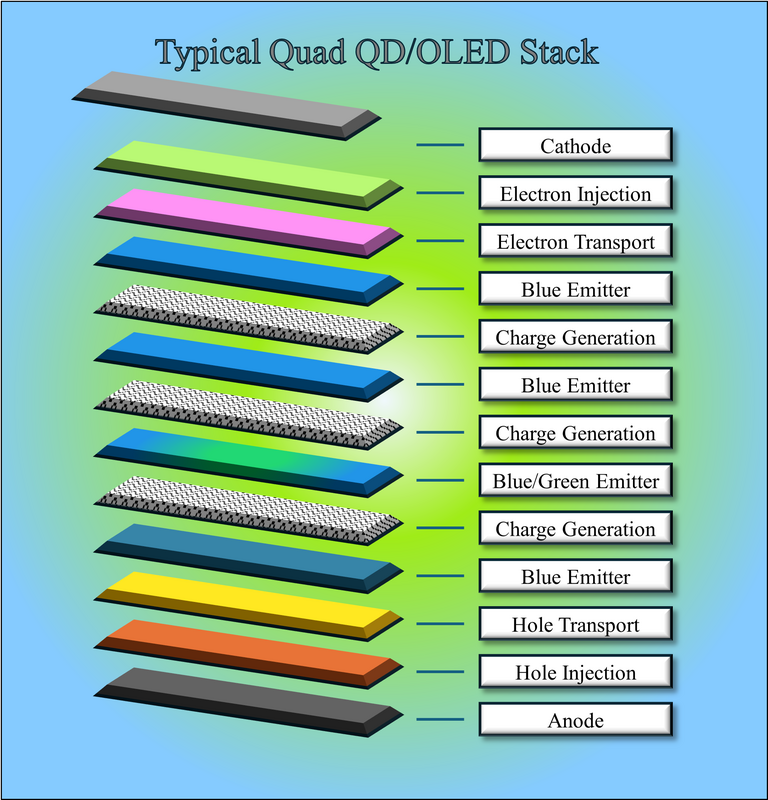
- OLED – (15 Models) Samsung uses two technologies for its OLED TVs. QD/OLED, a quantum dot based OLED that is produced by Samsung Display (pvt), and WOLED (White OLED) which it buys from LG Display (LPL). While the detail of which technology is particular to each model, on a general basis the high-end price category is QD/OLED and the Low-end price category is WOLED.
- Quantum Dot – There are no Quantum Dot only TV sets in Samsung’s premium TV set line this year. Samsung does provide a single standard Quantum Dot line (QN60H) that is quantum dot enhanced but is not part of the premium lines. Quantum dots are used in some of Samsung’s ‘Specialty’ sets, such as the Frame and The Serif.

Cross-Category Price Optimization: The 65” Index
Even with structural cleanups, pricing overlaps across different display technologies still exist. To map how Samsung is positioning these competing technologies against each other in the showroom, we can isolate and rank the standard 65” models directly by price.
Even with structural cleanups, pricing overlaps across different display technologies still exist. To map how Samsung is positioning these competing technologies against each other in the showroom, we can isolate and rank the standard 65” models directly by price.

Engineering Fixes for the "Micro-RGB" Backlight Mismatch
This table illustrates the three price tiers. These sets are called “Micro-LED RGB”, meaning that each backlight LED no longer consists of a single blue LED that is converted into an RGB pixel with a phosphor or quantum dot color filter. This hierarchy brings us to an important technical distinction regarding the top-tier "Micro-RGB" sets. In these sets, each backlight LED no longer relies on a basic blue emitter converted via phosphors or a traditional color filter sheet. Instead, Samsung deploys miniature red, green, and blue LEDs (roughly one-fifth the size of standard sub-pixels) to generate a localized backlight point matching the exact color value of the targeted image zone.
This differs from true Micro-LED displays in that in the Samsung consumer product mentioned above uses traditional LCD technology, while true Micro-LED displays use only the light generated from the Micro-LEDs (It is critical to note that this is not a true emmissive Micro-LED display. These consumer models still utilize an active LCD panel, whereas true Micro-LED displays completely eliminate the LCD layer, using the light from the micro-LEDs directly.
In a true Micro-LED TV, there are 8.2944 million pixels, each with a red, green, and blue micro-LED (24.8832 million Micro-LEDs). Each pixel can represent any color and intensity. In the Samsung consumer “Micro-LED RGB” TV there are 5,000 backlight zones to light up over 8 million pixels, which means there is a significant mismatch between the backlight and each pixel, essentially meaning that each backlight point must illuminate over 1600 pixels. If in that 1600 pixel block there are blue pixels on one side and red pixels on the other, the backlight has to decide whether to be red or blue (or purple), which doesn’t always match the image. This can lead to less precise colors than might be possible with a color filter.
Samsung has engineered a number of ways to compensate for this. Rather than increase the number of ‘zones’, which comes at a steep cost, Samsung is thought to employ a simpler color filter, not at the level of those used in its standard LCD TVs, but one that helps to ‘corral’ the light a bit to lessen color bleed. The real trick is Samsung’s AI engine, specifically designed to predict real-time luminance and color leakage across adjacent zones, proactively adjusting block intensity to minimize visible halo artifacts. While this digital patch does not completely erase the architectural limitations of an LCD bottleneck, the resulting visual output easily supersedes standard Mini-LED performance, justifying its place at the apex of Samsung’s pricing ladder
Channel Clearance Trends: Deflation in Legacy 2025 Inventory
Most recent 30 day summary

We expect the most recent price declines in the Samsung 2025 premium Mini-LED TV line were in anticipation of the release of the 2026 line, which is rather different than the 2025 line. The changes in the 2026 line would require distributors and retailers to make room for new inventory, both at the high end (dollar value) and the low end (physical) in order to capitalize on the momentum and high margins behind the initial release. Consequently, multiple 2025 SKUs have just plunged to all-time lifetime lows.
For those looking to build a home theater, Samsung’s QN115QN90F, a 115” Mini-LED/QD behemoth, a bit over 8.4 ft wide and 4.82 ft high, has dropped in price from $27,000 to a new low of $25,000, now almost 17% below its original MSRP of $30,000. For those with less wall space and smaller budgets, both Samsung’s QN75QN80F (75”) and the QN65QN80F (65”) sets also hit new lifetime lows, with the 75” model dropping from $1,600 to $1,400 (↓12.5%) (Originally $2,300), and the 65” model dropping from $1,000 to $900, now at 50% of its original $1,800 MSRP. If you are willing to forego 2026 bells and whistles the need for inventory space and capital typically creates value and for commercial buyers or custom installers unconcerned with the 2026 AI backlighting algorithms, the immediate cash-flow demands of the 2026 structural retail reset are opening up significant, high-yield buying opportunities
Strategic Outlook: The Cost of Market Leadership
Samsung’s aggressive 2026 restructuring is a textbook defensive maneuver against structural changes in the display industry. By splitting its Mini-LED line, expanding dual-sourced OLEDs, and introducing the premium "Micro-RGB" tier, the company is attempting to out-architect competitors it can no longer out-produce on a pure hardware level.
Protecting the premium tier comes with significant challenges:
- Engineering vs. Asset Dominance: Chinese brands like TCL and Hisense have successfully converted their subsidized LCD infrastructure into a high-yield Mini-LED advantage. Samsung is forced to rely on complex AI processing and algorithmic corrections to maintain a performance gap, compensating for its lack of in-house LCD manufacturing.
- The Squeezed Middle Tier: As the 65-inch pricing index demonstrates, Samsung’s mid-tier OLEDs, high-end Mini-LEDs, and entry-level Micro-RGB models are priced closely together. This overlapping layout risks confusing consumers and cannibalizing sales within the company's own lineup.
- Inventory Demands: The immediate downward pressure on remaining 2025 inventory shows how quickly value drops when a product line is reorganized. Retailers are slashing prices on larger models like the 115-inch flagship to clear warehouse space, demonstrating the high financial cost of shifting to a new hardware cycle.


 RSS Feed