Good News, Bad News: Navigating Container Shipping Rates and Weak Global Demand in 2025
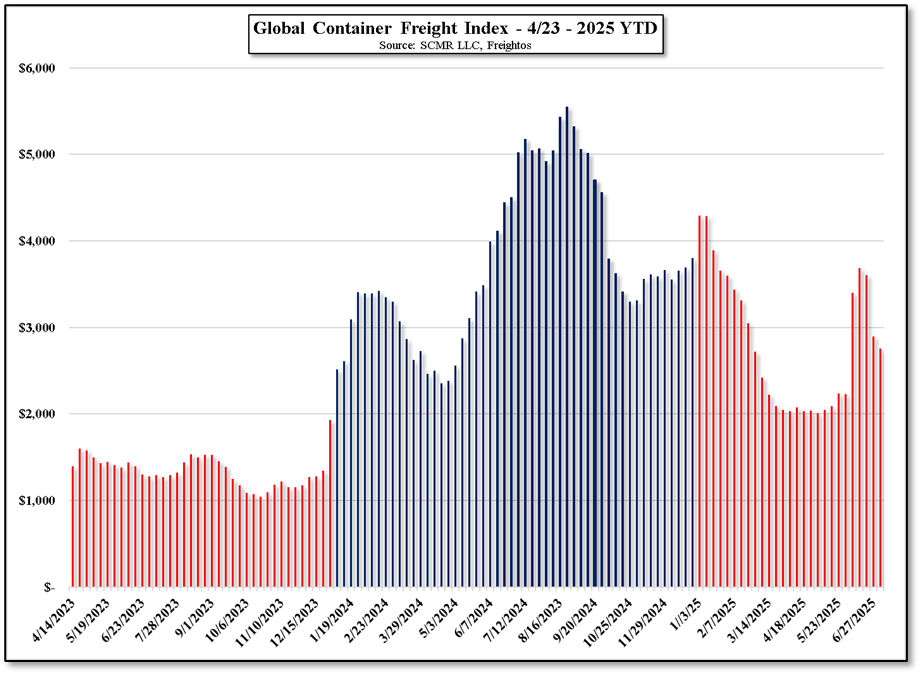
The 2025 container shipping market presents a key paradox for global logistics: while ocean freight rates are trending downward, the decline is a symptom of concerning weak global demand. The good news is shipping container rates are down for the year, following 2024, a year that saw container indexes climb 96.9% (FBX). On a YTD basis rate indexes are down 42.3% (FBX) and down 38.7% (FBX01[1]) on a YTD basis.
The drop can be attributed mainly to two factors:
Index
1Q
2Q
3Q
4Q YTD
2025 YTD
FBX
↓46.1%
↑41.2%
↓35.3%
↑17.2%
↓42.3%
FBX01
↓54.7%
↑55.0%
↓45.3%
↑59.7%
↓38.7%
Source: SCMR-LLC, Freightos
Red Sea – Geopolitical Impact: Red Sea Shipping Disruptions and Houthi Attacks
After a quiet period in May & June, Houthi forces resumed their attacks on Israeli affiliated or neutral shipping vessels, leaving most Red Sea shipping lanes closed with the majority of traffic normally accessing Red Sea ports and the canal rerouting around the Cape of Good Hope. This continues to weigh on container growth, albeit secondary to trade issues, which continue to pressure growth, especially in North America. (imports ↓0.5% YTD, Exports ↓2.7% YTD).
2025 Ocean Freight Market Outlook & Historic US Tariff Headwinds
We expect little change in ocean container rates for the remainder of the year, excluding one-time events such as port strikes or aggressive trade rhetoric. We believe expectations for 1Q are for relatively modest rate changes based on weak global demand, especially in the US market.
Domestic US Logistics – LTL Carriers
There is a separate dynamic for domestic US logistics. There is a chance that LTL (Less than Truckload) US carriers will try to put through a price increase to cover cost pressure, despite the rate decreases seen this year. All in container rates are down (Good News) however the reason for the decline is weak demand (Bad News).
Historic US Tariff Analysis
In addition to market dynamics we revisited historic tariff data. The current US effective tariff rate of 22.3% is considered the highest in the post-war era. The calculation is based on weighted mean tariff rate applied across all product categories (Section 301 and Section 232) over the total value of imported goods . The Trump Presidencies are in red..
Conclusion – Navigating the 2025 Global Logistics Landscape
The primary takeaway for investors in 2025 is a fundamental shift in logistical global market dynamics. While the significant 42.3% YTD decline in ocean freight rates (FBX) provides welcome cost relief for importers (the "Good News"), it is a direct consequence of pervasive weak global demand and persistent container overcapacity (the "Bad News").
This downward rate pressure is robust enough to overcome major geopolitical hurdles, including the ongoing Red Sea shipping disruptions that force costly rerouting around the Cape of Good Hope.
Looking forward, we expect largely stable ocean container rates for the remainder of the year. However, attention must be paid to critical secondary factors:
[1] China/East Asia to West Coast/North America Route
The drop can be attributed mainly to two factors:
- A bit of container overcapacity combined with weak demand, and while not quite getting back to 2023 levels, the combination has brought rates down considerably this year after a dismal 2024. Overall ocean capacity for this year is expected to increase by ~8% while demand is expected to grow ~3% lending credence to the expectations for a substantial full year cost decline.
- Weak Demand - A general slowdown, especially in North America, which contributed to US import volumes falling 0.5% YTD.
Index
1Q
2Q
3Q
4Q YTD
2025 YTD
FBX
↓46.1%
↑41.2%
↓35.3%
↑17.2%
↓42.3%
FBX01
↓54.7%
↑55.0%
↓45.3%
↑59.7%
↓38.7%
Source: SCMR-LLC, Freightos
Red Sea – Geopolitical Impact: Red Sea Shipping Disruptions and Houthi Attacks
After a quiet period in May & June, Houthi forces resumed their attacks on Israeli affiliated or neutral shipping vessels, leaving most Red Sea shipping lanes closed with the majority of traffic normally accessing Red Sea ports and the canal rerouting around the Cape of Good Hope. This continues to weigh on container growth, albeit secondary to trade issues, which continue to pressure growth, especially in North America. (imports ↓0.5% YTD, Exports ↓2.7% YTD).
2025 Ocean Freight Market Outlook & Historic US Tariff Headwinds
We expect little change in ocean container rates for the remainder of the year, excluding one-time events such as port strikes or aggressive trade rhetoric. We believe expectations for 1Q are for relatively modest rate changes based on weak global demand, especially in the US market.
Domestic US Logistics – LTL Carriers
There is a separate dynamic for domestic US logistics. There is a chance that LTL (Less than Truckload) US carriers will try to put through a price increase to cover cost pressure, despite the rate decreases seen this year. All in container rates are down (Good News) however the reason for the decline is weak demand (Bad News).
Historic US Tariff Analysis
In addition to market dynamics we revisited historic tariff data. The current US effective tariff rate of 22.3% is considered the highest in the post-war era. The calculation is based on weighted mean tariff rate applied across all product categories (Section 301 and Section 232) over the total value of imported goods . The Trump Presidencies are in red..
Conclusion – Navigating the 2025 Global Logistics Landscape
The primary takeaway for investors in 2025 is a fundamental shift in logistical global market dynamics. While the significant 42.3% YTD decline in ocean freight rates (FBX) provides welcome cost relief for importers (the "Good News"), it is a direct consequence of pervasive weak global demand and persistent container overcapacity (the "Bad News").
This downward rate pressure is robust enough to overcome major geopolitical hurdles, including the ongoing Red Sea shipping disruptions that force costly rerouting around the Cape of Good Hope.
Looking forward, we expect largely stable ocean container rates for the remainder of the year. However, attention must be paid to critical secondary factors:
- Trade Headwinds: The effective US tariff rate of 22.3%—the highest in the post-war era—continues to act as a significant, non-freight cost burden on imported goods.
- Domestic Costs: Shippers must also watch for independent price increases from LTL (Less than Truckload) US carriers, which face their own domestic cost pressures.
[1] China/East Asia to West Coast/North America Route

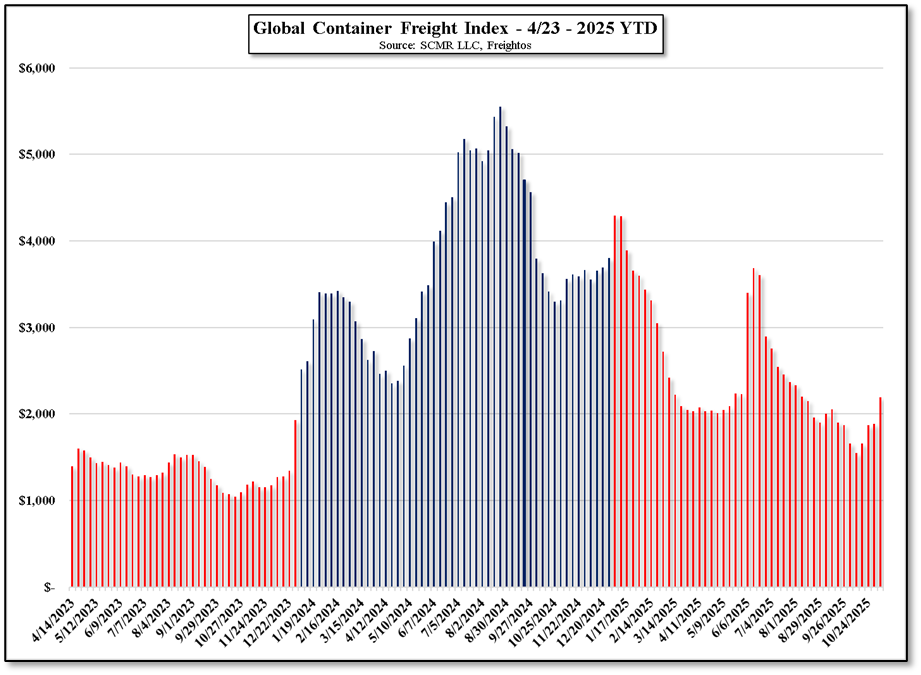
Figure 1 - Global Container Freight Index - 4/23 - 2025 YTD - Source: SCMR-LLC, Freightos
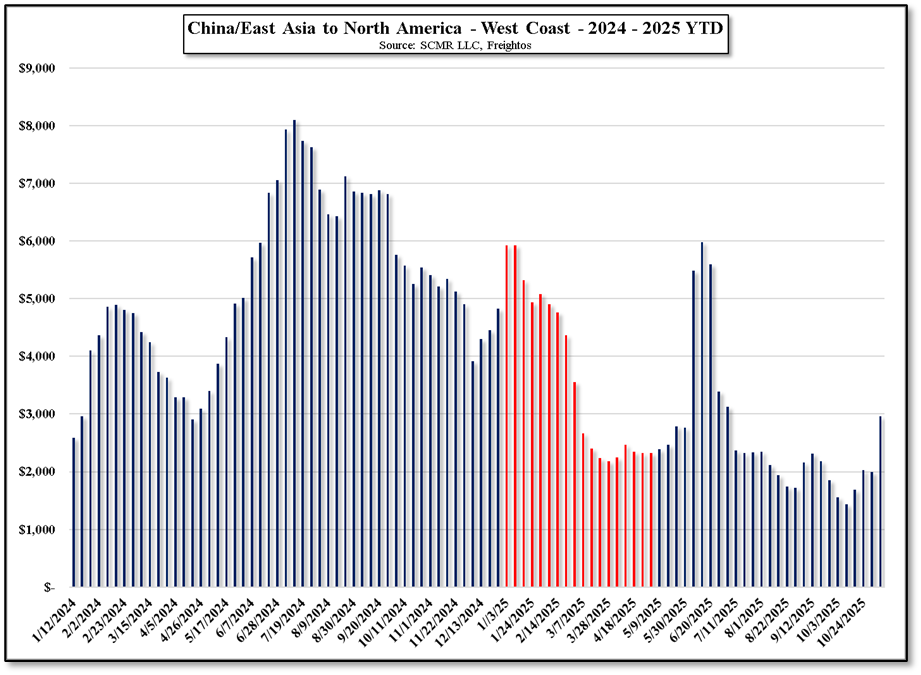
Figure 2 - China/East Asia to North America - West Coast -FBX01 - 2024 - 2025 YTD - Source: SCMR-LLC, Freightos
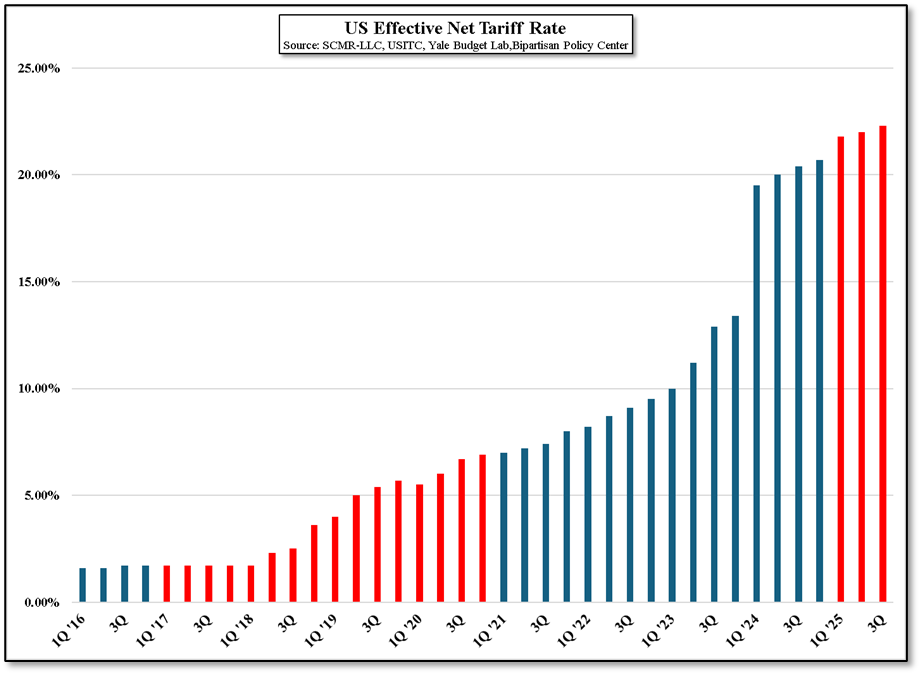
Figure 3 - US Effective Net Tariff Rate - Source: SCMR-LLC, USITC, Yale Budget Lab

 RSS Feed