Supply Chain Market Research - SCMR LLC
  • Blog
  • Home
  • About us
  • Contact

Huawei Enters the E-Paper Market

3/18/2022

0 Comments


Huawei Enters the E-Paper Market
​

Huawei (pvt), formerly the world’s leading telecom company and at one time the second largest smartphone brand, has enetered the E-Paper market with the release of the MatePad Paper, an e-paper based tablet, similar to the Amazon (AMZN) Kindle line.  The device has a 10.3” display, uses Wi-FGi 6+, and has a 3625 mAh battery that lasts 28 days in standby mode and charges in 1.5 hours (6 day charge).  As the e-paper display is only refreshed when the image or text changes, the system has the ability to recognize the type of content being viewed, which keeps power requirements to a minimum but also allows for smooth images when viewing GIFs or embedded documents.  The display itself is produced locally but the technology is licensed from E-Ink Holdings (8069.HK).
The device is based on Huawei’s internally developed Kirin 820E Chipset (7nm) and runs Huawei’s Hongmeng operatring system (Harmony OS2) which allows data to be transferred to any other Harmony device, which would include newer Huawei smartphones, and uses the M-pencil, also produced locally,, with up to 4,096 pressure sensitivity levels.  Unfortunately the local production capacity for the device is still small and the device was sold out on an e-mall site after 1,000 nits were pre-sold so it will take time for Huawei to gain traction in terms of volume numbers, however given the company’s size and brand recognition in China, this new product category for Huawei should have an impact on the global e-paper market eventually as the global unit volume for e-paper tablets is ~15m units.  The device sells for ~$471 US.  The Kindle Oasis (high-end) sells for ~$280 (ad-supported).
Given the pressure on Huawei’s business segments, a result of the US sanctions against the company, Huawei has been looking to develop new business segments of expand those that it is able to source on the Chinese Mainland.  While E-Ink is based in Taiwan, and should fall under the US trade restrictions, we expect that either a license has been granted by the US, given the low-tech nature of e-paper, or the details of the trade sanctions allow for pure technology licensing as it would be hard to prove that the license was based on technology developed using US produced tools.  Either way it seems that Huawei was able to get around the ban in this instance but has been severely limited in where it can source its components, which likely accounts for the lack of supply, especially given the 7nm node processor, which would have to be produced by SMIC (688981.CH), China’s only 7nm capable fab (just barely), and would be in completion for that capacity with both itself and other Chinese CE companies that are under the same restrictions.
Picture
Huawei MatePad Paper - Source: Huawei
0 Comments

Google Buys Micro-LED Start-up

3/18/2022

0 Comments


Google Buys Micro-LED Start-up
​

While not announced officially, it seems Google (GOOG) has bought a small California start-up, Raxium (pvt), that specializes in the development of micro-LED displays, particularly for AR applications.  The company’s technology is based on light field displays, which can produce 3D images without the optics normally associated with 3D viewing.  In a normal display the image is scanned by its volume (picture the slices of a loaf of bread), while in light field displays scan radially (picture layers of a cake), allowing at least two ‘layers’ to reach each eye.  Since those images are from slightly different locations on a horizontal plane, you are able to ‘see’ around an object just by moving your position.
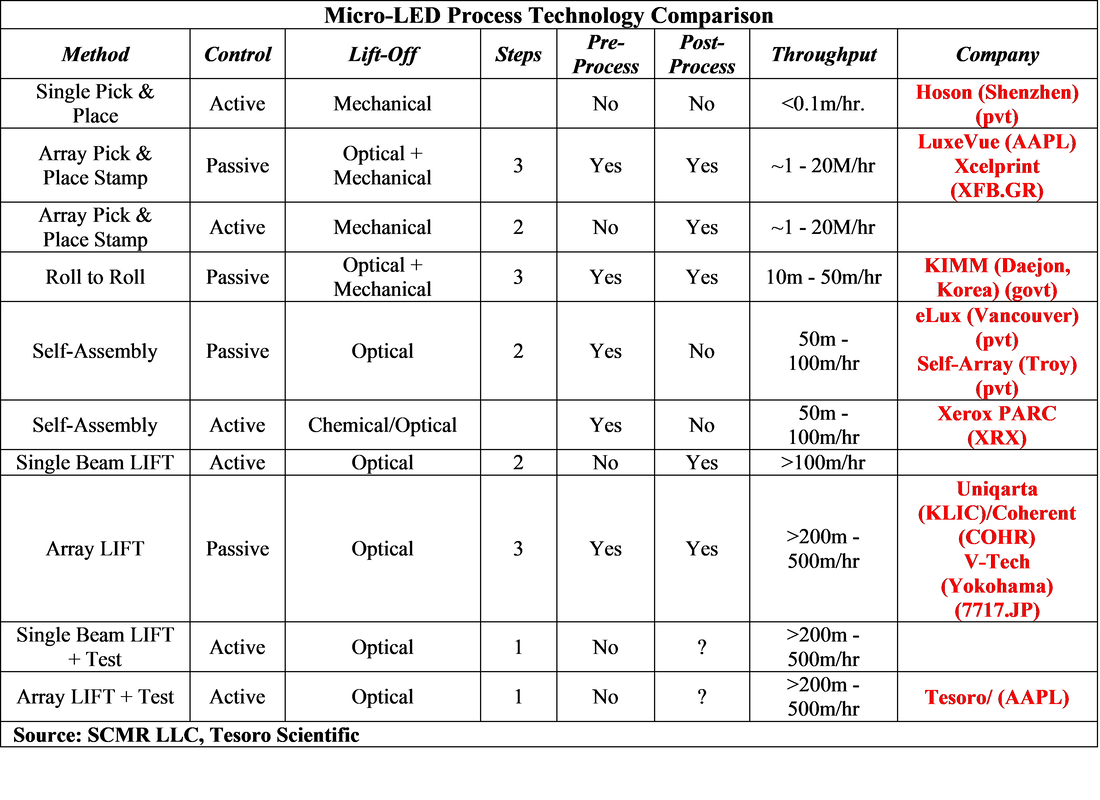
One issue concerning light field imaging is that they require a large number of ‘elements’ in order to capture the ‘cake slices’, some 2 to 3 times what might normally be used in volumetric imaging, and that is where Micro-LEDs come into the picture, as they are considerably smaller than typical pixels and sub-pixels, allowing designers the ability to place a greater number of imaging elements in the same space as more typical self-emitting display systems.  That said, producing micro-LEDs and placing them on control circuitry is a difficult task and makes such a process an expensive one, which is reflected in the high cost of Micro-LED displays, and those are using much larger Micro-LEDs than would be needed here.  Raxium is also developing a process for producing ‘monolithic’ Micro-LEDs (see Figure 5), essentially LEDs that are produced directly on a silicon substrate, as opposed to sapphire substrates from which they have to be transferred.
The application that we expect has interested Google here is the use of light field imaging in an AR device, which would allow someone using such a device to see a far more realistic image overlaid on the real world, and in theory, the user should be able to see more than just a ‘flat’ image overlay, being able to look ‘around’ the object to get a better perspective on how it fits with the actual image he sees through the glasses.  The example might be an engineer wearing such glasses, who was replacing a part on a mechanical device, could bring in the image of a replacement part to see what other parts might need to be removed to install it, but would also be able to see around the part just by shifting his view, rather than having to load static images of the sides or back of the part. 
This is only one application of such an AR device and there are so many more that large company’s like Google, Apple (AAPL), Microsoft (MSFT), Meta (FB), and a slew of smaller companies have been trying to develop micro-display technology that will enable AR since ~2013, when Google announced the abortive ‘Google Glass’ device.  We expect that Google sees Raxium as another step toward such a device and we expect the valuation for Raxium might be high, but if it advances Googles efforts toward a ‘revolutionary’ AR device, the cost is worth it. In the long run.
 
Picture
- Raxium Micro-LED Pixel Comparison - Source: Raxium
Picture
- 3 Dimensional Monolithic Micro-LED Display & Transistor Matrix - Source: Meng, W., Xu, F., Yu, Z. et al. Three-dimensional monolithic micro-LED display driven by atomically thin transistor matrix. Nat. Nanotechnol. 16, 1231–1236 (2021). https://doi.or
0 Comments

January Panel Sales & Shipments

3/18/2022

0 Comments


January Panel Sales & Shipments
​

For the first month this year large panel sales were down 3.9% m/m and down 0.8% y/y, better than the 5 year average of -6.0% m/m.  Large panel display industry shipments were down 4.6% m/m for January and up 3.8% y/y but better than the 5 year average of -8.7% m/m.  Shipments for all product categories were down m/m in January, which follows both the aggregate shipment trend and the large panel sales trend for the month.
Picture
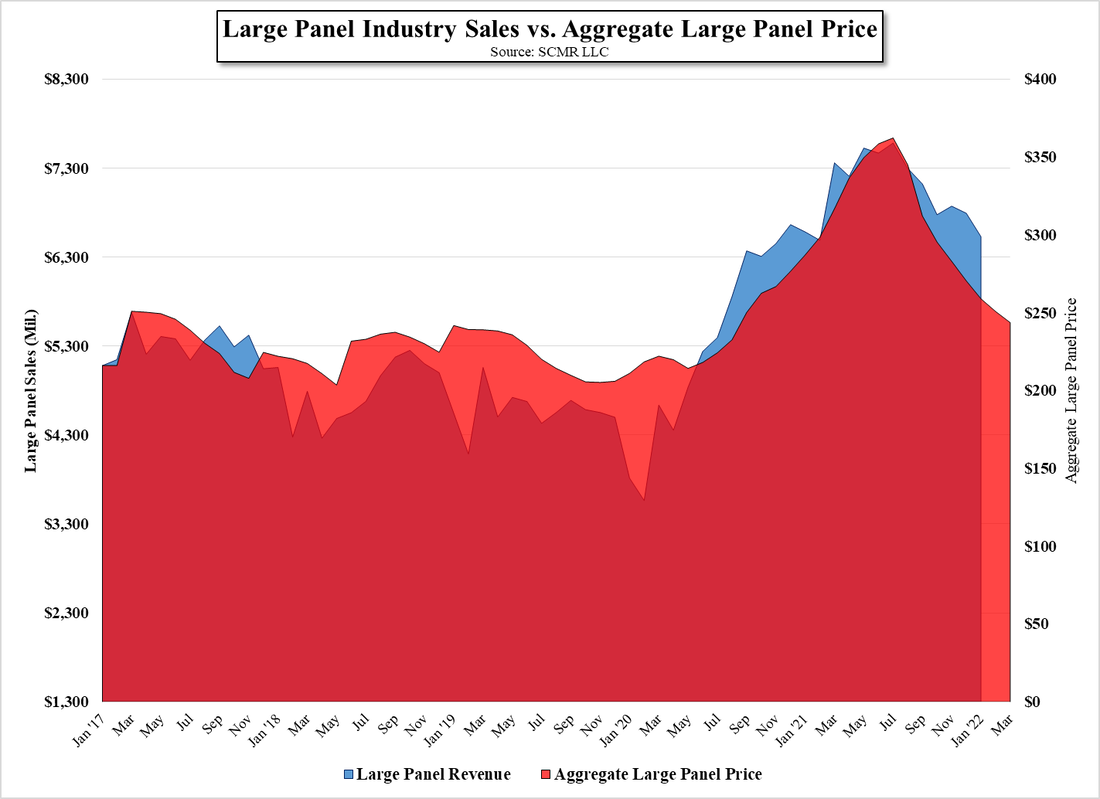
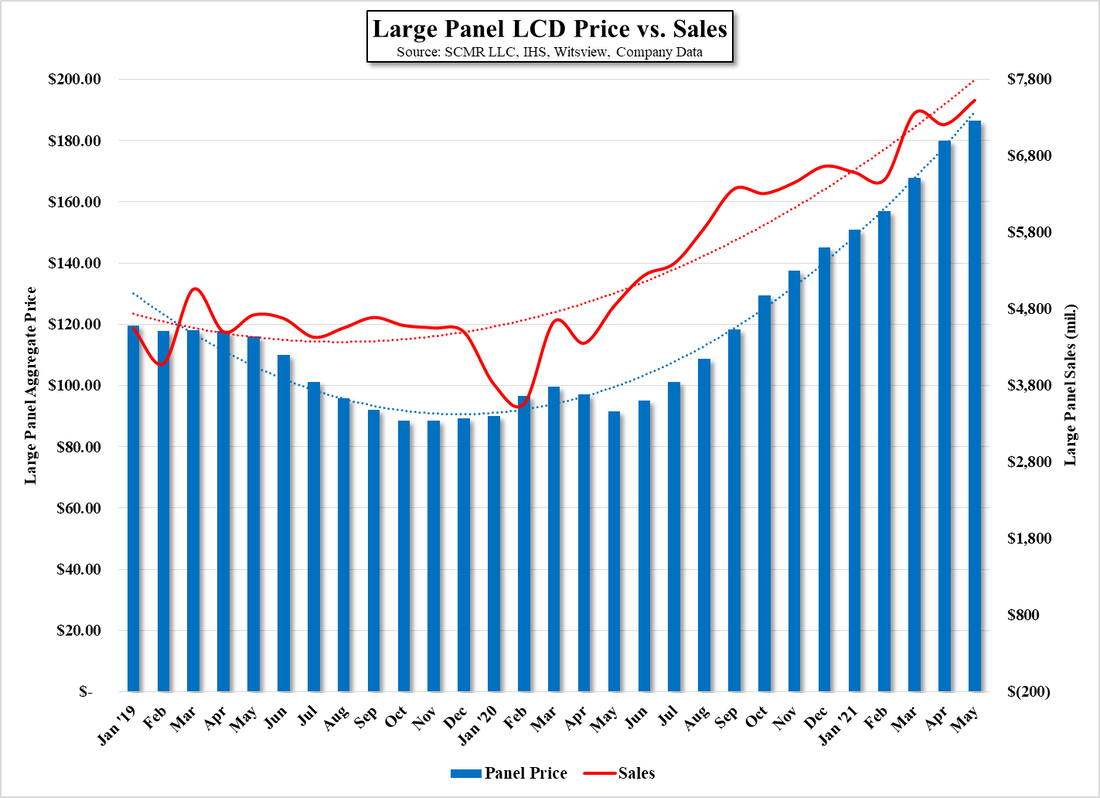
As we have large panel pricing data and a forecast for March pricing, Figure 1 overlays LCD large panel pricing over large panel sales, which gives an indication as to the expected trend in large panel sales through the end of March.  While the projection also depends on the accuracy of the March forecast, it would seem that we should continue to expect the industry to see declining sales in February and possibly in March.  While each panel producer has its own sales characteristics, we can see monthly sales data for AU Optronics (2409.TT) and Innolux (3481.TT), (Figure 2) which reinforce the downward trend scenario, given the release of negative m/m sales in February.
A bit more concerning is Figure 3, which shows the y/y change for each LCD large panel production region.  While South Korea has been negative for over a year as Samsung Display (pvt) winds down its large panel LCD production and LG Display (LPL) reduces same, Taiwan producers are now seeing revenue lower than one year ago and the trend for Japan and China large panel display revenue remains negative.  China has been the fastest growing region in the large panel display space, averaging 48.9% y/y growth (monthly average) last year, but saw only 10.7% y/y growth in January, bringing the region bringing February into the possibility of being the first month that China has not seen y/y growth in large panel display revenue since February 2018.
 
Picture
Large Panel Industry Sales vs. Aggregate Large Panel Price - Source: SCMR LLC
Picture
AU Optronics & Innolux Monthly Sales - Source: SCMR LLC, Company Data
Picture
Large Panel Display Revenue By Region - Y/Y 2020 - 2022 YTD
Picture
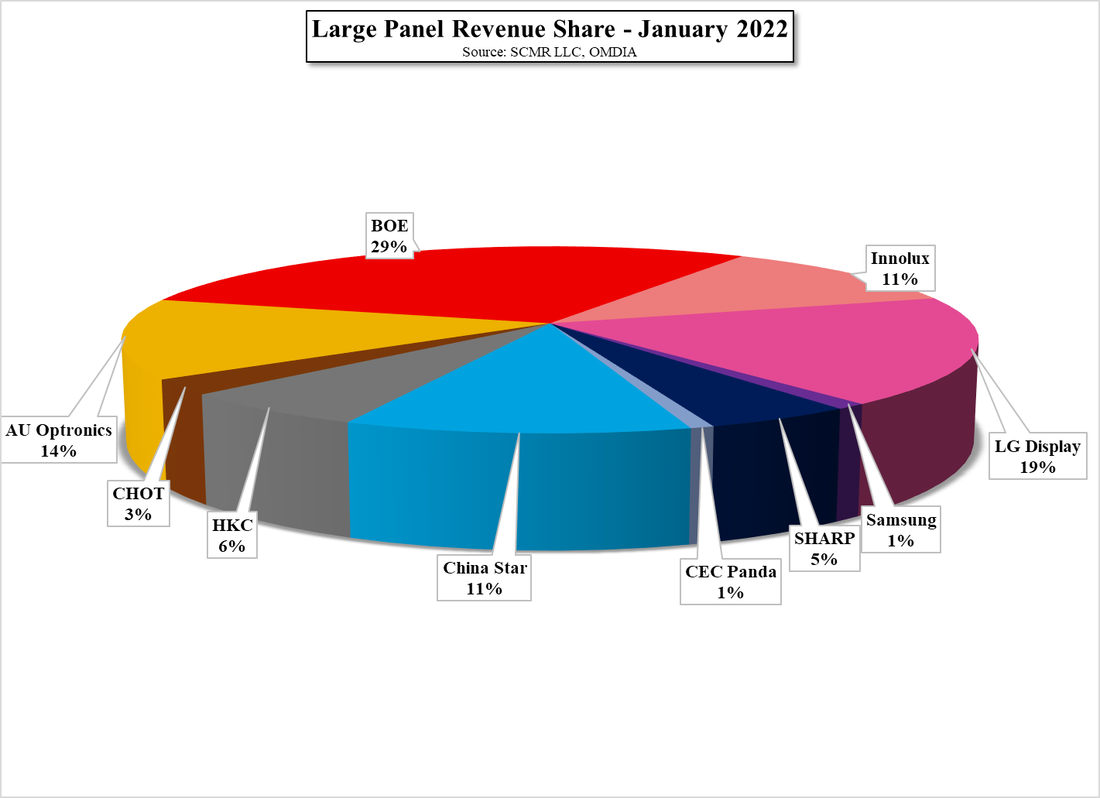
Large Panel Revenue Share - January 2022 - Source: SCMR LLC, OMDIA
0 Comments

AR Estimates

3/17/2022

0 Comments


AR Estimates
​

As analysts we pride ourselves on making the more accurate estimates possible for areas that we specifically model in the CE space and take care to define as much as possible as to outside estimates that we use in our notes.  That said, other than in our own models, it is difficult to know what is included or not included in CE product or market estimates, which can lead to vast differences between estimates and considerable confusion when trying to make comparisons.  Some CE product categories are relatively easy as they have been established for years and at least basic data is available if one knows where to look, however newer CE products can be quite difficult to track making estimates unreliable and conflicting, which tends to make investors (or should) nervous about putting capital to work in that area.
One of the more difficult of the new CE product categories is AR/VR, as distribution channels are varied, ranging from direct from manufacturer, brick & mortar sales, app stores, or distributors, and the inclusion of items like hardware or software development costs or consulting revenue can make market estimates unreliable.  That said, in some cases we can get a better definition as to what is included in estimates, and while that tends to not be the case in the VR/AR world generally as hype is a big part of this developing industry, there are some exceptions that we believe may lead to more reliable estimates.
We have seen recent data concerning AR revenue estimates that includes both consumer and enterprise categories, where we can get an idea of what is included or excluded from the data.  While we might agree or disagree on what should be included or not included, at least we have some understanding of what is in the numbers.  Here is what is in and out of the data:
Included
  • AR Hardware – AR glasses
  • AR Software – AR Application sales
  • AR Ad campaign (paid Ad placement) - but not the production costs of the campaigns
  • AR software sales that is used to facilitate purchases but not the value of those purchases
  • In-App Purchases
  • AR content creation software
 
Not Included
  • Smartphone sales – Despite the fact that some AR devices need to be paired to a smartphone, the phone can be used for other purposes so the cost of the phone is not included.
  • PC/Laptop/Game Console – Same as above
  • Enterprise consulting revenue
  • Development costs to produce AR content or applications
  • Transaction value of goods purchased using AR – If you buy a chair using AR, the value of that transaction is not included as it would be a retail furniture sale not an AR related product.
Network costs
 
We take exception to the idea that ad campaign revenue should be included in such data and wonder about what the category entitled ‘Enterprise Productivity’ actually means as we don’t have the ability to drill down further into the data, but it looks to be ~1/3 of the revenue stated for 2021, which gives us cause for concern, although it grows far more slowly that the overall totals for each subsequent year.  That said, at least there is a basis for understanding what is included and excluded from the data, which gives it more value than most.  We have additional concerns about the fact that while the growth rate decreases, which is to be expected, the trend line for forecasted years is quite linear, which is rarely the case in the CE world, but for now we take the data as at least a legitimate attempt at understanding the ability of AR to generate revenue.  The CAGR during the 2020 to 2025 period would be 24.9% based on the data.
Picture
Mobile AR Revenue Spending & Forecasts - Source: SCMR LLC, ARTillery Intelligence
0 Comments

Slicing 5G

3/17/2022

0 Comments


Slicing 5G
​

5G offers users a number of functional changes over existing 3G and 4G/LTE transport modes.  Higher speed, lower latency, expanded capacity, and increased bandwidth have all been bandied about as to the advantages that 5G provide for consumers and business, but there is another way in which 5G is an improvement over 4G/LTE and 3G, and while it might seem a bit subtle, it is of great importance to service providers who must find ways to justify the cost of building out 5G service and that is network slicing.  4G networks are essentially ‘one size fits all’, meaning that while a network can be divided segments for customers, each segment provided the same services.  If a customer was interested in a particular type of service, such as guaranteed availability for emergency services, they would receive the same network services as other customers or they would have to create a separate network.
5G architecture allows both the network bandwidth itself and its services to be ‘sliced’ according to the requirements of the customer, which will allow carriers to provide specific service packages for each customer.  This is particularly important for use in manufacturing and logistics where functional network needs vary considerably.  In logistics traffic notification requirements require low latency and high reliability, while infotainment would require higher bandwidth but less need for low latency and in manufacturing the ability to move large amounts of tool or process data would be key. 
While the above are just examples, the ability of 5G to be sliced gives it a flexibility that was not available in 3G or 4G and the design of 5G itself also allows carriers to automate the slicing process dynamically, meaning the ability to create a ‘slice’ in minutes.  So in the case of a traffic accident, a network operator could create a network ‘slice’ for first responders separate from that used by the general public for live streaming to social media, and then close the slice when the accident is cleared.  Much of this will be done under SLA’s (Service Level Agreements) that will specify the needs of customers while adjusting to the variabilities of traffic, performance needs, and other variables, and while 5G a more complex architecture than 4G such networks are ‘virtual’ in the sense that they are ultimately programmable, allowing automation to take over once the initial settings are made.  This allows for changes to be made easily and cost effectively for the carrier.
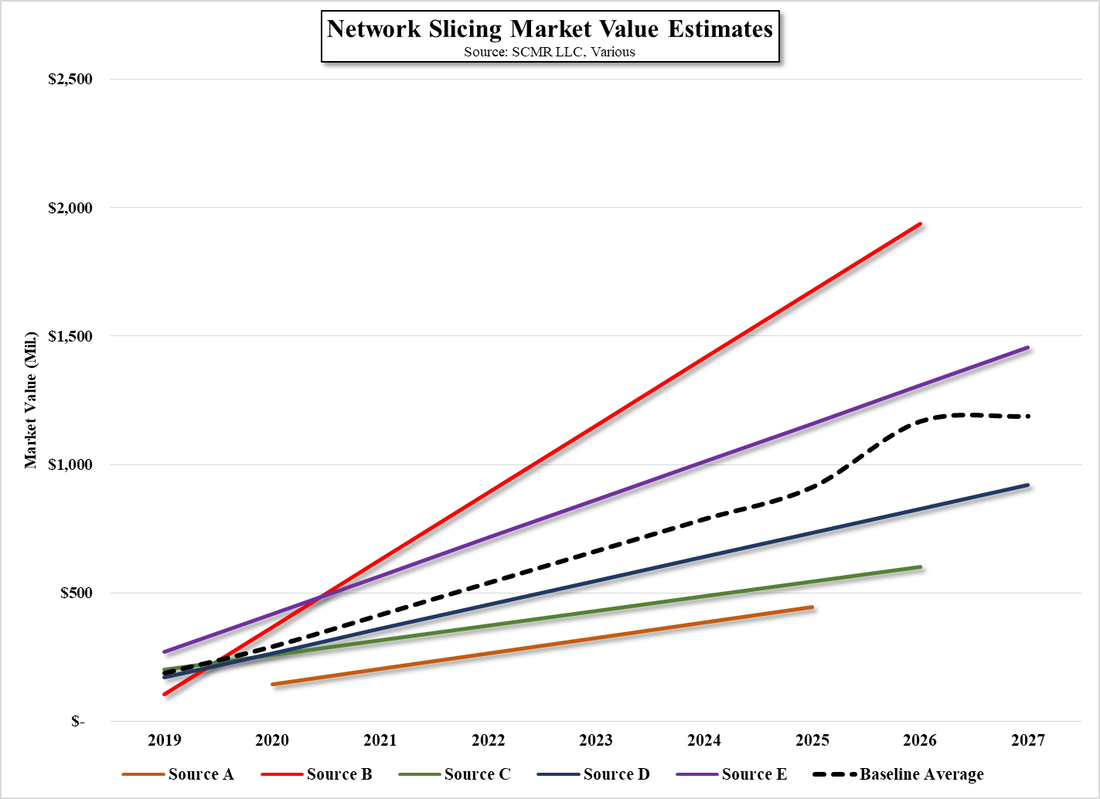
Industry estimates concerning the network slicing market are to say the least, unreliable, as inclusions and exclusions in terms of hardware and services can make a vast difference.  Figure 1 shows five estimates for the network slicing market, showing how considerable the variations are between estimates for the 2025 – 2027 periods and even the variability for past periods, such as 2019, where the estimate differences are between $105m and $270m.  While we expect to arrive at a more detailed market value for the network slicing market as we can make additional determinations as to what should be included, we have created an ‘baseline average’ from the existing estimates to lessen the effect of outliers.  The baseline average sets 2019 at $187m and 2027 at $1.189b with a CAGR of 22.8% for the network slicing market.
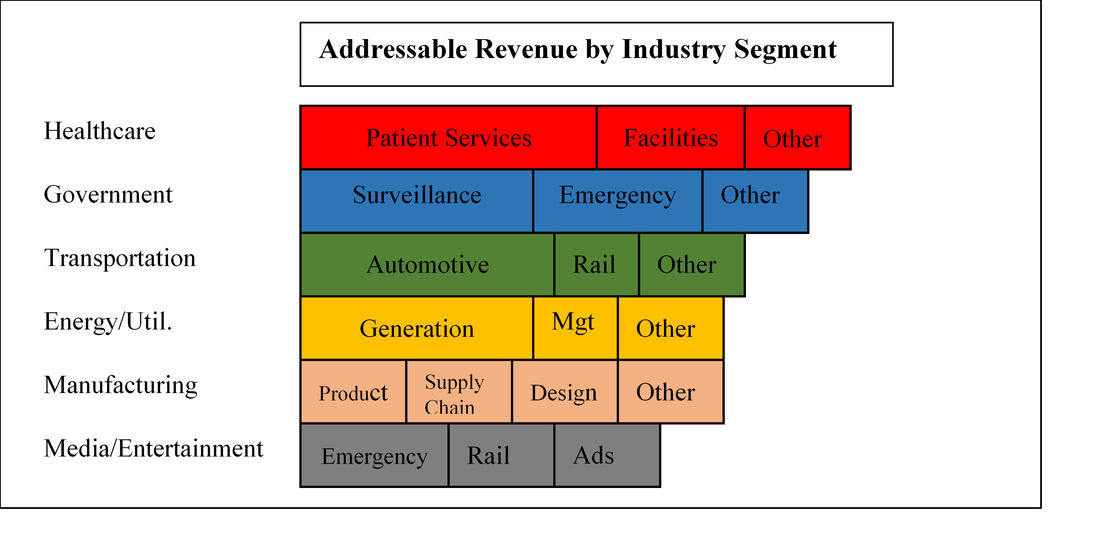
A study done by Arthur D Little looking at more than 400 digital use cases in 78 industries indicated that six of those industries would have 90% of revenue potential addressable for network slicing and that one or two use cases would account for much of the revenue in each industry.  This gives carriers a better understanding of where to focus their attention, with the total revenue potential for these six industries ~$180b out of a ~$200b potential market.  Figure 2 shows the relative breakout by industry and sub-segment for each of the top six.  While we expect there is some question as to how the potential revenue for each segment is determined, it does show which segments and industries have the most potential for generating network slicing revenue.
All in, the network slicing market is growing as 5G rollouts continue, represents a key source of service revenue for carriers and is almost completely hardware agnostic, allowing network slicing systems to allocate network services using AI and predictive algorithms while still meeting SLA requirements. Carriers and network operators can oversee the networks and make ad hoc changes but the cost of changes and short-term requests or allocations would be low relative to private networks or ‘one size fits all’ 4G provisioning, and initial SLAs could be easily tailored to the specific needs of each customer without building a ‘network’ for those specific prerequisites.  While network slicing will not be something that shows up in headlines as 5G service expands, we expect businesses, network operators, and carriers will be focused on ways in which they can offset the cost of building out 5G service to mobile customers by using network slicing to create new types of SLAs and use applications scenarios for their business customers.
Picture
Network Slicing Market Value Estimates - Source: SCMR LLC, Various
Picture
Addressable Revenue by Industry Segment - Source Arthur D. Little
0 Comments

Glass in China

3/17/2022

0 Comments


Glass in China
​

​As we have mentioned in the past, much is made in the Chinese trade press about the country’s ability to dominate the LCD display business over the last few years, and credit where credit is due, as Chinese display producers such as BOE (200725.CH), Chinastar (pvt), and HKC (0248.HK) have become dominant or major players in the LCD space, particularly in reference to large panel LCD display production.  Much of this comes from the addition of new LCD capacity at the Gen 8.5 or Gen 10+ substrate sizes, with particular emphasis on Gen 10+ fabs. 
One area that has been neglected by the Chinese display industry is glass substrates where much of the industry relies on a small number of display glass producers that are both well established and have a vast production knowledge-base.  While China does have a few display quality glass substrate production lines there is only one that is able to produce substrate glass for Gen 8.5 panel production and none that are able to produce substrates for Gen 10+ fabs, most of which are on the Mainland.  This leaves Chinese large panel producers to depend on Corning (GLW), Asahi (5201.JP), and NEG (5214.JP) for those substrate sizes, with some producers building glass production facilities for Gen 8.5 and Gen 10 on the production campuses of those fabs.
We have seen statistics as to how China is developing it substrate glass industry, soon to ‘dominate’ as the country has done with panel production, but in reality that bravado is a bit misconceived.  We see Gen 10+ panel production capacity growing 31.5% this year, representing 21.8% of total industry capacity, which is up from 14.8% of the industry total last year, with growth below Gen 8.5 non-existent in the LCD space.  As larger glass sizes tend to come at a premium, not only does Gen 8.5/Gen10+ glass represent the only capacity growth in the LCD space, but maintains higher margins than generic substrate glass sizes. 
Much of this is the result of the technology used to produce substrate glass, which requires considerable production and formulation expertise that is not easily generated during the production of other glass types, and as Chinese OLED panel producers have learned, that technology expertise takes considerable time and expense to learn.  All in, if Chinese glass ‘domination’ were near, we would expect Mainland producers to be in production at Gen 10+ sites across China, which it seems they are not and given the unusual stability of substrate glass prices over the last few years, competition is little changed.
0 Comments

Epistar Mini-LED Update Update

3/16/2022

0 Comments


Epistar Mini-LED Update Update
​

​Last week we noted that Epistar (3714.TT) was expanding its Mini-LED capacity in both Taiwan and China with plans to increase capacity by ~25% from 1.2m 4” equivalents to 1.5m, lower than original expectations of a ~50% increase across both regions.  The company has now indicated that the China production lines will have a capacity (new) of 300,000 4” equivalents, which would absorb all of the new capacity we noted.  Given that we expect a capacity increase in Taiwan also, we expect the expansion plans are now for greater than 25% capacity expansion by the end of this year.  While not all of this capacity will be on line at the onset, Chinese capacity will start operation in 2Q.
While a number of Chinese LED producers are working toward Mini-LED mass production, most are still in trials with Mainland panel producers and in small quantity production mode.  China’s largest LED producer Sanan (600703.CH) has been in such trials but will likely not move into volume production until 3Q or 4Q of this year at the earliest, leaving Epistar the first mover advantage in China.    China’s largest panel producer BOE (200725.CH) has been developing glass based mini-LED backlighting products for both large TVs (75”) and monitors, and is said to be in mass production, but given the specific nature of the backlight (75” 8K) and the rigid characteristics, we expect it is more of a low volume product.  
0 Comments

Samsung Keeps Up the Metaverse Talk

3/16/2022

0 Comments


Samsung Keeps Up the Metaverse Talk
​

​At Samsung Electronics’ (005930.KS) shareholder meeting the company once again indicated that the Metaverse was one of two areas that it has selected as new growth businesses (the other is robotics).  Samsung’s Vice Chairman indicated that he would actively seek business opportunities in Metaverse which sparked renewed speculation that the company was preparing to announce or release a “Metaverse Device”, as he indicated last month at Mobile World Congress.  As we noted previously, no specifics were given although we noticed that the company’s Metaverse site 837X (Decentraland) is closed until March 21 when a new event is planned.  While this could be nothing more than new merchandise, it would be a good place to drop a few hints to the AR/VR community.
Given the extreme hype surrounding the Metaverse and Samsung’s expertise and history in the display space, it is easy to connect the dots as to Samsung’s eventual plans however as we noted in our 3/1/22 note, Samsung has been in and out of the VR space before and will likely take a more realistic approach to the AR/VR space in this go-round.  However they cannot keep the Metaverse chatter going forever without a distinct product so we expect at least a glimpse of a product before the holidays this year.  If nothing occurs by the end of 2Q we expect there will be a slew of questions as to why such a device/product has not been revealed and pressure on management will be intense, so unless we are wrong and the current Metaverse talk is just ‘Chairman Speak’ (Why promise if nothing is almost ready?) Samsung should be back in the VR/AR world this year.
0 Comments

COVID in China

3/16/2022

0 Comments


COVID in China
​

As we noted yesterday, a number of cities in China have been subject to lockdowns this week, particularly Shenzhen.  The new case data for China has always been suspect and continues to be so, however even with the case reporting likely being overseen by the government, the chart below shows an uptick in cases, which is made more obvious in Figure 2, where we clipped the large spike seen during the period around February 13, 2020 during the initial outbreak.  China has not seen a rate over 1new case/million inhabitants since February 22, 2020, which makes the 1.48/million number from yesterday stand out even more.  
Picture
- COVID-19 - China - New Cases/Million - Source: OurWorldinData
Picture
COVID-19 - China (Adjusted) - New Cases/Million - Source: OurWorldinData
0 Comments

Who Owns What?

3/16/2022

0 Comments


Who Owns What?
​

Chinese panel producers are a complex lot.  Transactions between various controlling and non-controlling entities can make understanding ownership a difficult task especially given that fabs under a common company name may be owned by different parties.  That said, we are always on a constant search to isolate current ownership of Chinese panel producers to give us a better understanding of how much support these companies are given by government entities, as opposed to panel producers outside of China where governmental influence and financing is less or non-existent. 
Tianma (000050.CH) is one such Chinese panel producer and while we cannot be sure that every fab, executive office, sales office and support center falls under the corporate umbrella noted below, the company does give a look at current ownership as part of its 2021 annual report.  Here’s what it looks like:
Total number of ordinary shareholders: 96,674
Total number of shareholders in Previous Month: 93,422
Picture
​To summarize, state owned entities are 8 of the top 10 shareholders in Tianma, with a total of 58.87% of the outstanding common shares.  All of the entities marked in red have interlocking ownership or cross-entity holdings and while holder #7 is listed as a corporation, it has a ‘concerted action agreement’ with AVIC International Holdings to continue to invest in the company, essentially a source of funds when needed.  We assume Hong Kong Clearing is a broker holding shares in street name for individual investors, however we could find little on the only top 10 individual investor listed above.  He or she has 3 holdings with Tianma being over 85% of the portfolio but little else is known about affiliations with the company or the Chinese government. 
All in, Tianma is essentially a state-owned entity and as such we look more toward the years in which the industry faces difficult challenges to see how much government support is needed to keep the company profitable.  We do note that Tianma has been expanding capacity and will open a new Gen 6 OLED line this year, so we expect continued growth from a unit volume perspective although in previous quarters Tianma has had a relatively small share of the small panel OLED market.   
0 Comments
<<Previous
Forward>>

    Author

    We publish daily notes to clients.  We archive selected notes here, please contact us at: ​[email protected] for detail or subscription information.

    Archives

    May 2025
    April 2025
    March 2025
    February 2025
    January 2025
    January 2024
    November 2023
    October 2023
    September 2023
    August 2023
    June 2023
    May 2023
    February 2023
    January 2023
    December 2022
    November 2022
    October 2022
    September 2022
    August 2022
    July 2022
    June 2022
    May 2022
    April 2022
    March 2022
    February 2022
    January 2022
    December 2021
    November 2021
    October 2021
    September 2021
    August 2021
    July 2021
    June 2021
    May 2021
    April 2021
    March 2021
    February 2021
    January 2021
    December 2020
    October 2020
    July 2020
    May 2020
    November 2019
    April 2019
    January 2019
    January 2018
    August 2017
    July 2017
    June 2017
    May 2017
    April 2017
    March 2017
    February 2017
    January 2017
    November 2016
    October 2016
    September 2016

    Categories

    All
    5G
    8K
    Aapl
    AI
    AMZN
    AR
    ASML
    Audio
    AUO
    Autonomous Engineering
    Bixby
    Boe
    China Consumer Electronics
    China - Consumer Electronics
    Chinastar
    Chromebooks
    Components
    Connected Home
    Consumer Electronics General
    Consumer Electronics - General
    Corning
    COVID
    Crypto
    Deepfake
    Deepseek
    Display Panels
    DLB
    E-Ink
    E Paper
    E-paper
    Facebook
    Facial Recognition
    Foldables
    Foxconn
    Free Space Optical Communication
    Global Foundries
    GOOG
    Hacking
    Hannstar
    Headphones
    Hisense
    HKC
    Huawei
    Idemitsu Kosan
    Igzo
    Ink Jet Printing
    Innolux
    Japan Display
    JOLED
    LEDs
    Lg Display
    Lg Electronics
    LG Innotek
    LIDAR
    Matter
    Mediatek
    Meta
    Metaverse
    Micro LED
    Micro-LED
    Micro-OLED
    Mini LED
    Misc.
    MmWave
    Monitors
    Nanosys
    NFT
    Notebooks
    Oled
    OpenAI
    QCOM
    QD/OLED
    Quantum Dots
    RFID
    Robotics
    Royole
    Samsung
    Samsung Display
    Samsung Electronics
    Sanan
    Semiconductors
    Sensors
    Sharp
    Shipping
    Smartphones
    Smart Stuff
    SNE
    Software
    Tariffs
    TCL
    Thaad
    Tianma
    TikTok
    TSM
    TV
    Universal Display
    Visionox
    VR
    Wearables
    Xiaomi

    RSS Feed

Site powered by Weebly. Managed by Bluehost