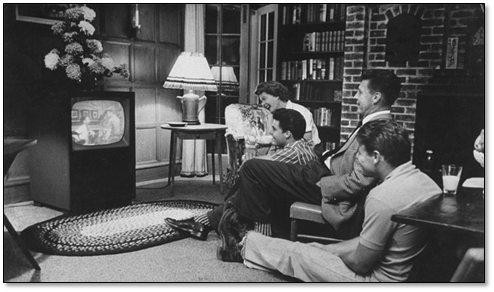
Sitting around the TV in the 1950's - Ozzie & Harriet Nelson - Source: Life
If you are old enough, you might remember sitting in front of the TV with your entire family watching the Apollo 11 moon landing, along with 650 million other folks, or more recently, the last episode of ‘Friends’ in 2004, viewed by 52.5m folks. But the days of families sitting around the TV are gone, replaced by DVRs and streaming services that allow viewers to work and play on their own schedules and not those of major networks. Just to recap, there was a time when TV programs were broadcast at a very specific time, and if you were unable to sit in front of the TV exactly at that time, you missed your show, no VCR and few, if any, rebroadcasts, just gone into the archives of old TV programs (hopefully).

1969 Moon Landing - Source: History.com
Such is no longer an issue, with the ability to time shift and the availability of a wide variety of copper or fiber systems that rebroadcast an endless supply of ‘Seinfeld’, ‘Law & Order’, or ‘The Simpsons’, and streaming services that compete for eyeballs and wallets with both existing and in-house content. But no longer is the data on who is watching what in the public domain, as typical viewership services like Nielsen (NLSN) and Comscore (SCOR) are unable to gather the same comprehensive data that they used to derive by tabulating every second of TV watching from a selected group of ‘families’. DVR usage is only able to be tracked voluntarily, and streaming services only provide data sporadically, usually when the data is good, so trying to understand who is watching what has become a much more complex issue.

Of course, the connection to consumer electronics is obvious, as every viewer is using some sort of display, be it a conventional TV, tablet, PC, or smartphone, and said devices all fall under the CE banner, but we were surprised when we learned of how opaque viewing data has become, and how segmented viewership is today. Here’s an example made public by “The Hollywood Reporter”, a showbiz rag that was able to gain access to the data for the premier 2nd season episode of “Abbot Elementary”, a show coming off of two Emmy wins. 2.92m viewers watched S2E1 on its home channel, ABC (DIS) during the first 7 days of its broadcast, which would be considered mediocre, but when added to the 2.68m viewers who saw the episode on Hulu (DIS) or the ABC streaming app and the 1.38m viewers who watched it on their DVR (Nielsen data), ratings fall back into a range commensurate with the series’ success.
With broadcast viewers having only a slightly larger share than Hulu/ABC Streaming, the cross-platform data becomes increasingly important, however it seems that each network calculates that data differently. For example, HBO (WBD) touted a massive 44m viewers who watched the final episode of “Game of Thrones”, but that included up to 6 weeks of streaming and replays of the season premiere, along with 5 weeks of episode 2, and, well you get the picture… Nielsen, at least, has expanded its sample households from ~5,000 in 1997 to 40,000 homes (100,000 people) in 2020 and continues to do so, accordingly a 2.0 rating now equates to a 2% share of the adults between the ages of 18 and 49, or about 2.56m viewers. This means there is no real standard for viewership currently, and the combined data tends to be revealed only in discussions between advertisers, content creators, streaming services, and networks with only snippets of information available to the public.
That said, there is some data, at least on a general basis that can be derived, with the basis being ‘same-day ratings’, essentially anyone who watches a show on the night it airs (up until 3AM the next day). Live sports and news programs tend to be the bulk of same-day ratings, as magazine-based shows like “20/20” are often delayed by viewers, with Dramas high in the same-day mix. Comedies tend to be delayed and entertainment shows fall between 40% and 50% viewership on the night they are aired, but with DVRs typically part of a cable or satellite system, and that category losing ~25m homes since the peak in the 2017 – 2018 season, so the lift formerly seen over the 7 day period after a show was aired (captured on DVR) has also dropped by 29%, and overall same-day viewing has declined by almost 33% over the same period, which puts streaming data as an increasingly important metric for the industry.
There are many new services that have proprietary measurement systems for streaming data, but black box systems can only guess at the hard data that most streamers keep to themselves and the fact that many viewers do not watch on standard TV platforms. HBO reported that an average of 9m viewers were ‘first-nighters’ for its “House of the Dragon”, but it turns out that only 1.87m actually watched it at 9PM when it was originally broadcast on HBO, and similarly the Showtime (CBS) series “Yellowjackets”, which averaged ~5m viewers during the first season, had barely 6% of viewers watching on its first on-air showing. This has led streaming services to use terms like ‘over the course of the run’ , ‘Live+35’, or ‘over 4 weeks’ when giving out numbers, as longer periods are added to statistics to allow shows to look like progressively bigger hits.
With new data providers promising better and more accurate data, advertisers have to work their way through considerably more data than when Nielsen was the only data available, and each advertiser has their own favorite metrics. Some look at numbers for those that watch at least a minute or two of shows while others look at time spent, but as streaming services focus more on ad-supported services, ad buyers will need considerably more data than the streaming service itself might provide, and while there is still considerable room for data services to add to commercially available streaming data, Nielsen is still the leading data provider, even knowing that the data is relatively incomplete. As we expect that advertisers will find data supplied by streamers themselves progressively less reliable, companies like iSpot (pvt), VideoAmp (pvt), and Parrot Analytics (pvt), have an opportunity to gain standing in an industry that has been dominated by a single company for many years if they can prove their data reflects the interests of advertisers more accurately, but given the lack of transparency from many streaming services, it will not be an easy task.

 RSS Feed