Bitcoin Ban Brings Big Boon?
China has power problems and the biggest cost of bitcoin mining is power. In order to reduce power consumption China has essentially banned bitcoin mining across the country, forcing bitcoin mining organizations to move mining facilities to locations that are both amenable to mining itself and have exceptionally lower power costs. Much of the equipment is transportable in that it is essentially servers with high capacity graphics cards that are used for performing complex calculations, and can be readily adaptable to server farms almost anywhere on the globe.
The portability of such equipment and mining itself can be seen in the two infographics below, with the first showing a global map of bitcoin mining power consumption in May of this year, with the darker colors indicating the most bitcoin power draw. The second infographic shows the same map for the July period, where we note that China, dark brown in May, is devoid of bitcoin power consumption in July, and Fig. 6 shows how bitcoin energy consumption peaked in April, decreased quickly during the transition period and has begun to move back up as the miners relocated.
So where did all the bitcoin miners migrate to? The US, which now makes up 35% of the bitcoin hash rate (roughly where China was earlier this year) is now the home to the most mining operations, with Kazakhstan (18.1%) and Russia (11.2%) in 2nd and 3rd place. While you would never know such a trasition has taken place, China’s problem will eventually become ours, as bitcoin mining will continue to grow and capture more of the global power grid, with the result being the additional cost of power capacity being added to your utility bill, or power outages. Perhaps a mandate from the government limiting bitcoin power consumption might be in the cards somewhere down the road, albeit a bit less stringent than China’s ‘all out’ decree, but the balance between making bitcoin miners wealthy and keeping the lights on seems an easy one to make.
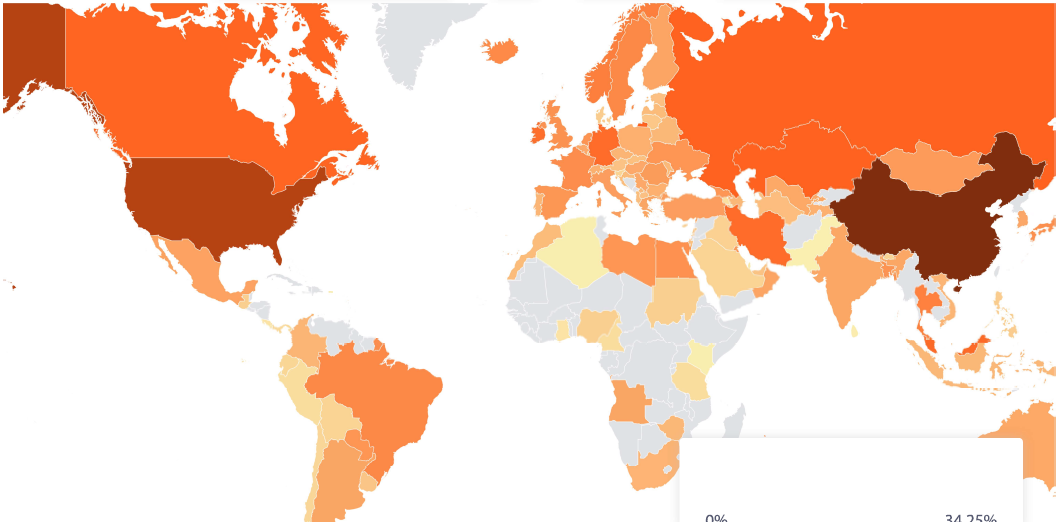
Bitcoin Hash Power Consumption Map - May 2021 - Source: University of Cambridge
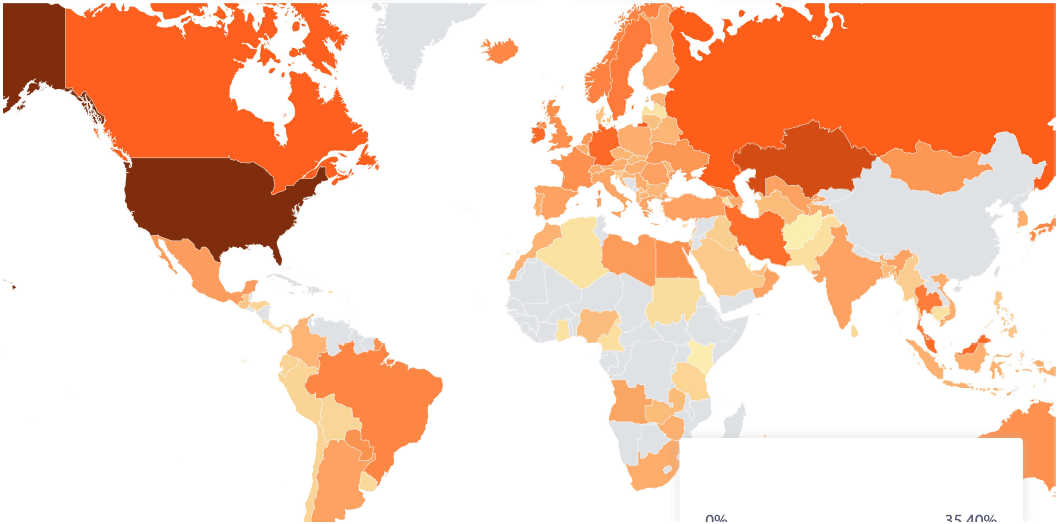
Bitcoin Hash Power Consumption Map - July 2021 - Source: University of Cambridge
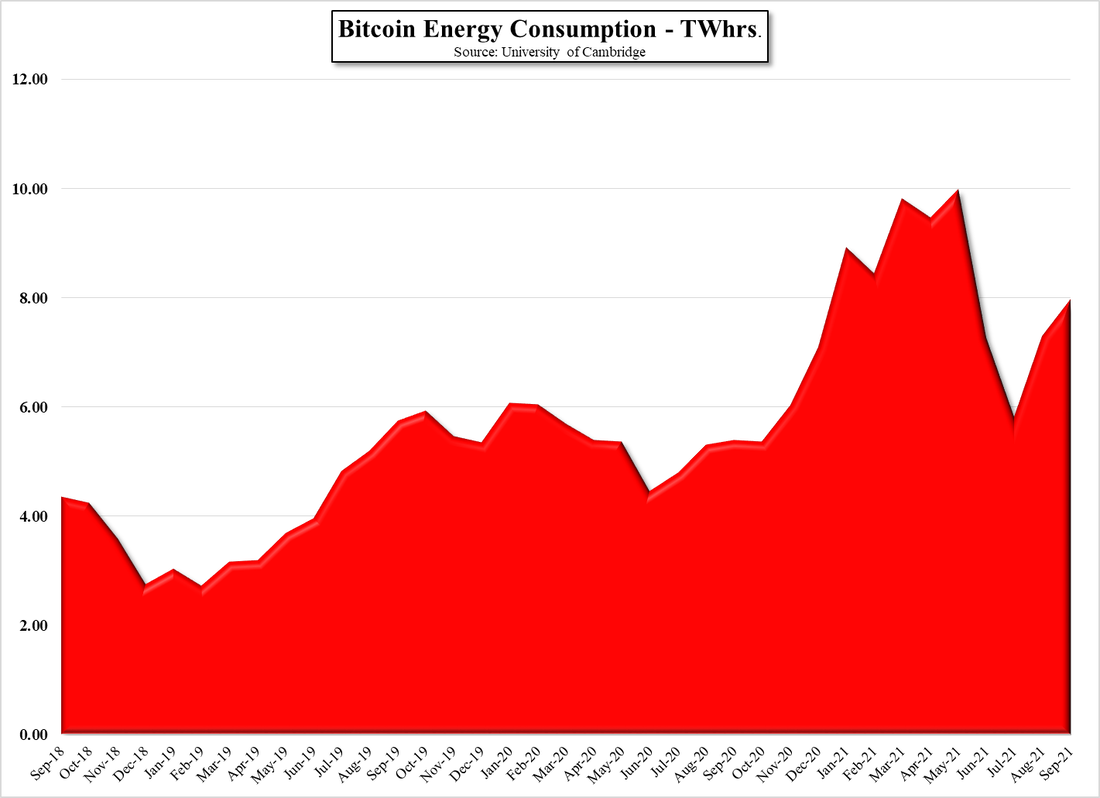
Bitcoin Energy Consumption - TWhrs - Source: University of Cambridge
 RSS Feed