Real iPhone Data From China
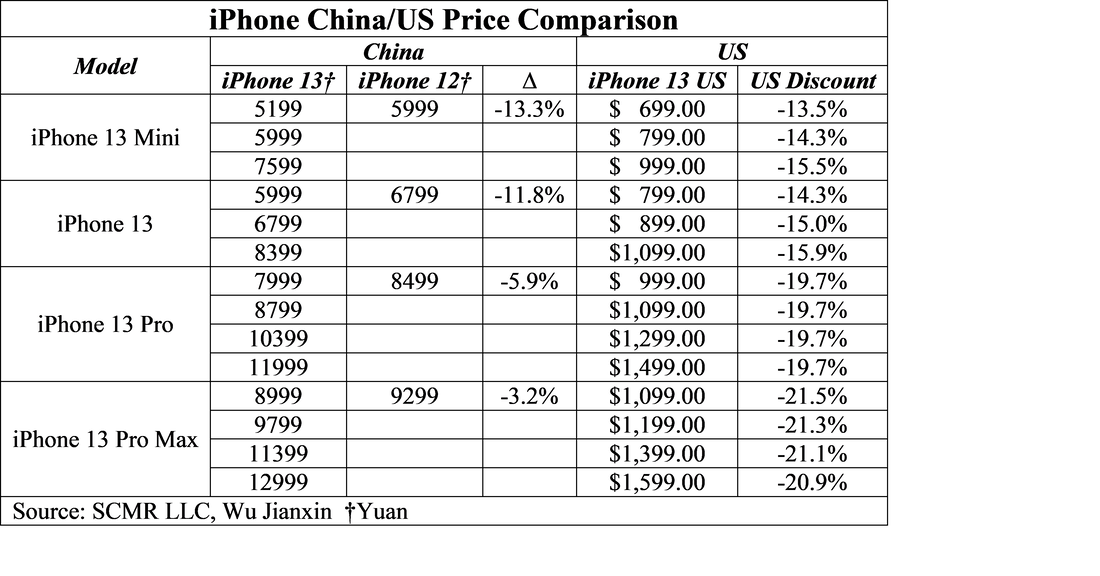
As we noted, Apple has maintained pricing for this year’s iPhone 13 family relative to last year, however in China the price of the new iPhone 13 series, while higher than in the US, is lower than the starting prices seen for the iPhone 12. As can be seen in the table below base models of the iPhone 13 are less expensive than the iPhone 12 (original price) by between 3.2% and 13.3%, but still remain at a premium to US prices, which are between 13.5% and 21.5% less expensive. Currency has played a part in the decrease, but Apple’s component cost leverage and a desire to stave off domestic competition are also factors.
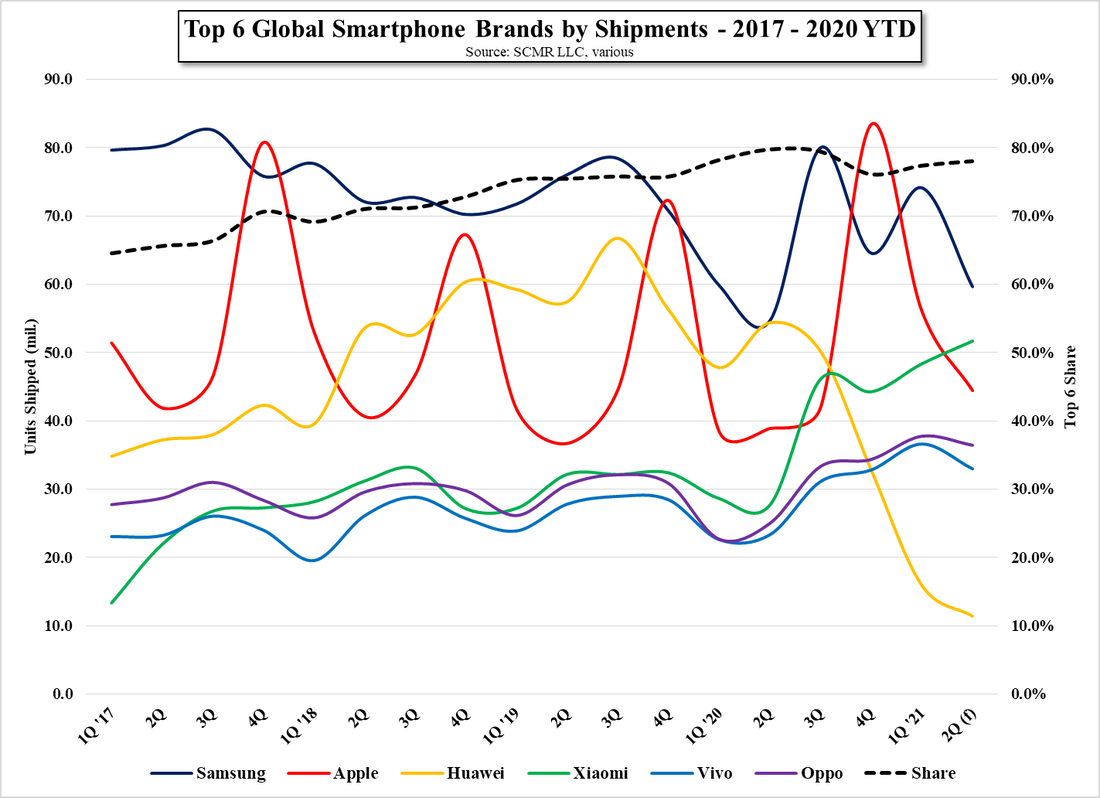
Apple’s biggest competitors in China are from domestic brands, particularly Oppo (pvt), Vivo (pvt), and Xiaomi (1810.HK), whose share of 21.2%, 23.7%, and 17% all outperformed Apple’s 11.8% share in 2Q ’21. That said, Apple will have at least a part of 3Q and all of 4Q to gain share now that the iPhone 13 has been released and we expect the lower price could attract a bit more attention, or at the least provide some competition against those Chinese domestic brands that have tried to move up to more premium oriented smartphone models, especially given the massive pressure put on Huawei by US trade sanctions. While we expect Apple is looking to squeeze a few more share points out of China for the remainder of the year by lowering prices a bit, they will also likely slow those domestic brands from moving up the price curve at the same time.
Apple’s biggest competitors in China are from domestic brands, particularly Oppo (pvt), Vivo (pvt), and Xiaomi (1810.HK), whose share of 21.2%, 23.7%, and 17% all outperformed Apple’s 11.8% share in 2Q ’21. That said, Apple will have at least a part of 3Q and all of 4Q to gain share now that the iPhone 13 has been released and we expect the lower price could attract a bit more attention, or at the least provide some competition against those Chinese domestic brands that have tried to move up to more premium oriented smartphone models, especially given the massive pressure put on Huawei by US trade sanctions. While we expect Apple is looking to squeeze a few more share points out of China for the remainder of the year by lowering prices a bit, they will also likely slow those domestic brands from moving up the price curve at the same time.


 RSS Feed