Universal Display – What we expected & what we got – Part 1
Universal Display (OLED) reported 4th quarter and full year 2016 results last night. Yesterday we posted our expectations for the quarter, 2016 year, and for 2017, so what did we get? Starting with the simple stuff, consensus estimates for 4th quarter revenue was $68.6m, which the company beat by 8.7%, reporting $74.577m. The full year 2016 company guidance was $190m to $200m ($195m sp[i]) and consensus was $192.9m, putting the consensus beat at +3.1%, and +2.2% over our full year estimate. Reported EPS was $0.55, 31% above consensus and 22% above our estimate, which put full year reported EPS at $1.02, 14.6% above consensus and 10.9% above our $0.92 estimate. As we have noted many times in the past, at this point in the development of OLED technology, the accuracy of quarterly estimates is of far less importance than the full year results, given the potential for pushes and pulls during the industry’s capacity expansion phase. While its always nice to be accurate on a quarterly basis, and we know investors are sensitive to quarterly performance, our true focus is on yearly metrics.
Guidance for 2017 was set at $230m to $250m ($240m sp), which was slightly (-1.6%) below the 2017 revenue consensus of $243.9m. No EPS guidance was given, while consensus for 2017 is $1.29. The table below gives some further 4Q detail as to reported metrics and our expectations.
[i] Single point
Guidance for 2017 was set at $230m to $250m ($240m sp), which was slightly (-1.6%) below the 2017 revenue consensus of $243.9m. No EPS guidance was given, while consensus for 2017 is $1.29. The table below gives some further 4Q detail as to reported metrics and our expectations.
[i] Single point

Yesterday we noted that we were watching for the following points (in a different order):
1. Color relating to the expiration/renewal of the Samsung Display (pvt) IP license and material supply agreements
2. A continuing increase in emitter sales, particularly red emitter
3. Some incremental improvement in LG OLED TV royalty
4. An increase in non-Korean product sales
5. A realistically optimistic view on 2017 sales that has some correlation to OLED capacity growth
1. While Universal Display cannot speak about potential negotiations with customers, nor do we believe that such negotiations are near any conclusion, we do believe that Samsung will be looking to sign a new long-term agreement with UDC as the old one expires at the end of this year. Should negotiations bog down as the 2017 year ends, we would expect a limited term renewal, but we do not expect Samsung to push for single year agreements with annual renewals. We do note that the current IP license contract has called for increases each year, and we were surprised that the 2017 increase was $15m, boosting the full year to $90m. As this rate was negotiated in 2013, and was based on the expected growth of the industry, we had expected the yearly increases to diminish as the industry grew larger and the rate of relative expansion slowed. That has not been the case as can be seen from Fig.1, and bodes well for the IP license revenue in a new long-term contract.
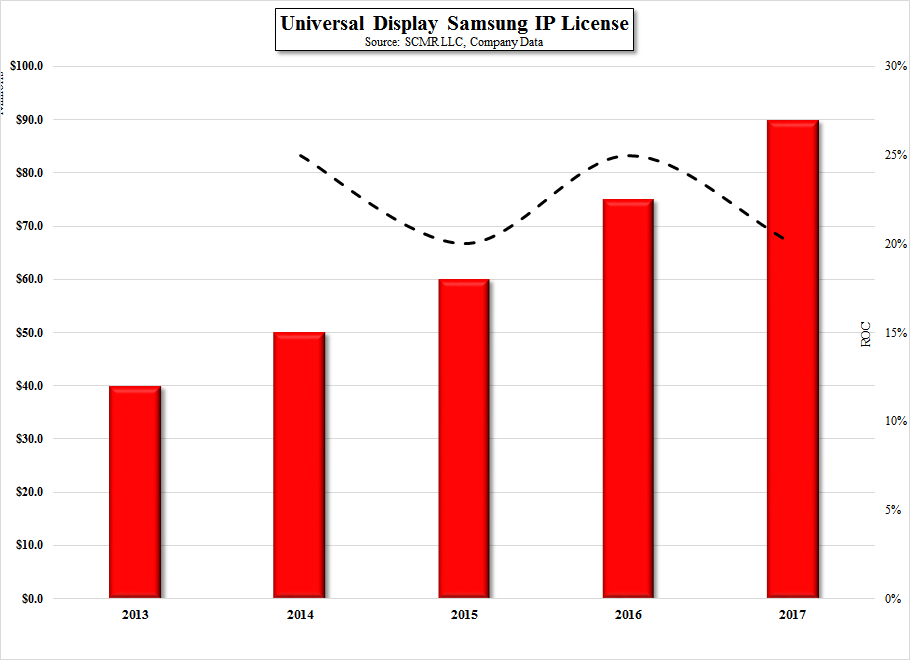
Universal Display - Samsung IP License - Source: SCMR LLC, Company Data
1. Commercial Emitter sales in 4Q increased, looking at the aggregate of both red, green, and other colors as seen in Fig.2., but declined on a total 2016 y/y basis. Our focus was on red emitter material, which is used in every RGB OLED display, and now potentially in OLED TV displays, while green is an option in many cases. Therefore red emitter sales should grow in step with industry capacity expansion. Of course, that excludes the increases in material efficiency that is the goal of every OLED panel producer, which can lessen that correlation, but given that UDC reports dollar value of emitter materials, not units shipped, the effect of ASP and volume discounts must also be considered. That said, we have been concerned that there has been no red emitter growth this year, making it more difficult to project long-term material sales that grow at industry expansion rates.
UDC kindly supplied a bit of color in that they indicated that total emitter shipments were up on a y/y basis, which indicated that the primary cause for the lack of growth was pricing. While this sounds even more onerous, cumulative material price discounts are part of the supply contracts that UDC has with all of its customers and are already built into our industry model. That said, as customers reach those volume targets, the value of material sales is impacted, although there is a ‘terminal volume’ at which no further discounts are given. UDC counters this issue by developing new materials, which restarts the ‘cumulative volume clock’ at full price as the new material is adopted. This year’s lack of emitter growth has been affected by a delay in the adoption of some of these new emitter materials by key customers, which would have boosted emitter dollar values as ASP’s were reset to higher levels.
This remains a concern, as the adoption of new materials is at the option of the customer, but upon detailed examination we note that looking at commercial emitter sales does not paint an complete picture, as UDC sells these new materials to customers for testing, but does not book them as commercial sales unless they are being used in a high volume commercial product. We believe a portion of UDC’s ‘developmental’ material sales includes these new materials, and as such, the commercial emitter material sales should be ‘adjusted’ to give a better picture of emitter growth, particularly red emitter. Fig.3 illustrates the absolute and adjusted red emitter quarterly growth in 2016 and indicates red emitter growth. Further, looking at ‘developmental’ material sales itself, there was significant growth in the 2nd half of 2016, which would imply both a higher volume of new materials being sampled to customers and a larger base of new customers that are not yet in commercial production but are using UDC emitter materials.
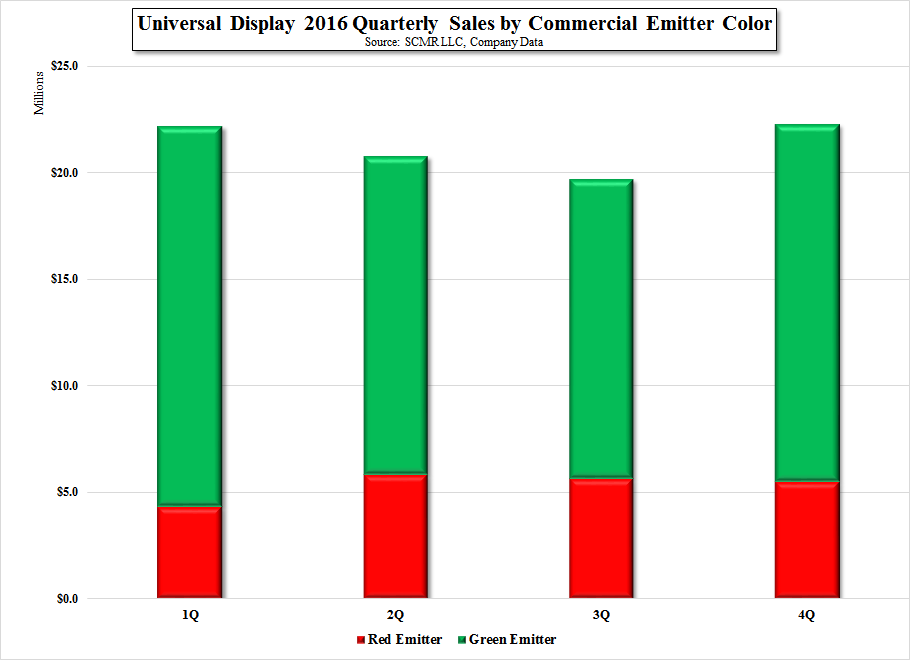
Universal Display - 2016 Quarterly Sales by Emitter Color - Source: SCMR LLC, Company Data
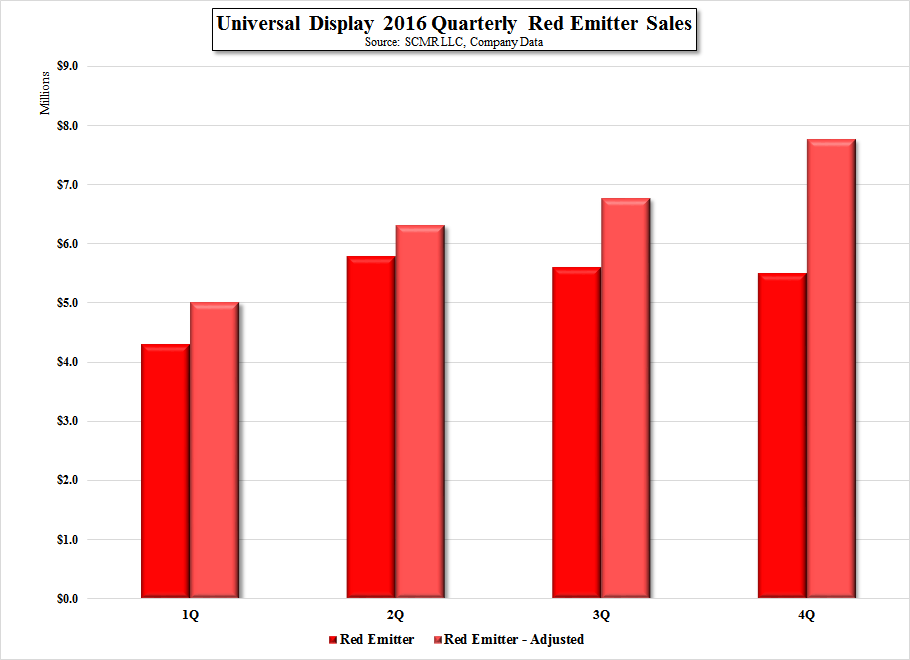
Universal Display 2016 Quarterly Red Emitter Sales - Source: SCMR LLC, Company Data
Given the constraints of our AM note, we will continue the review of the UDC results in our next note in order to give the depth we feel is necessary when discussing the OLED display space. Don’t touch that dial!
 RSS Feed