Fun with Data – Phone Usage
Most data concerning mobile phones is based on either shipment volumes or on phone sales value. Both of these metrics are able to provide a short or long-term view of the popularity of a particular phone model or brand and can help to understand sales trends, all of which are helpful in understanding the mobile phone market on a general basis. That said, neither metric gives any understanding of usage, a more esoteric but necessary metric for more detailed view of the mobile phone business. Usage statistics can indicate a number of points when trying to gain insight into the mobile market, such as:
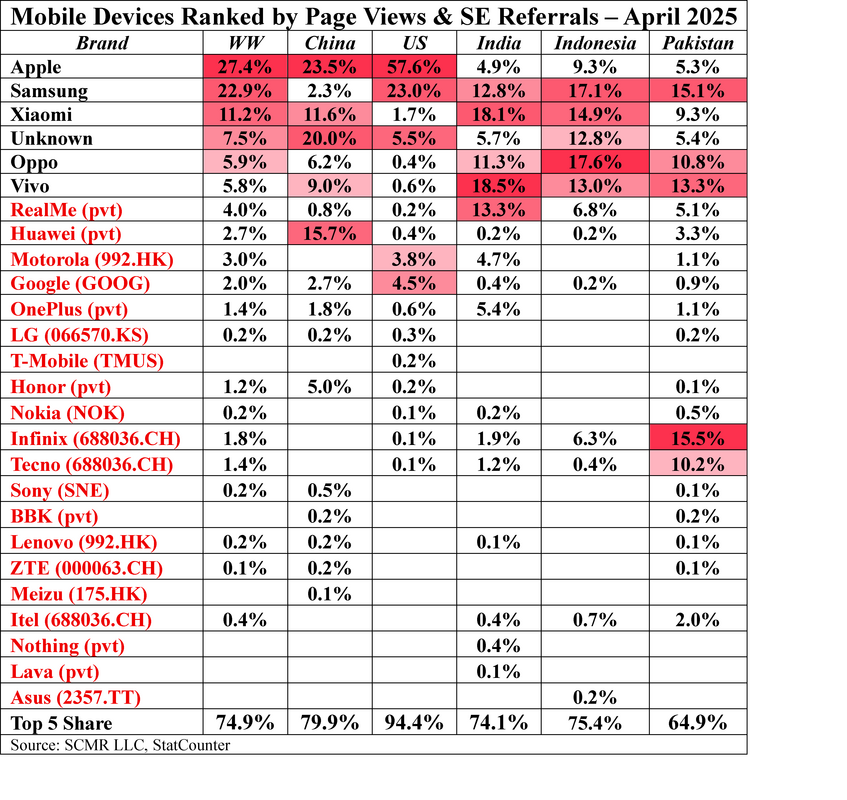
The US has the most brand loyalty, with Apple (AAPL), the top brand with a 57.6% usage penetration, more than twice the leader in any other country, and is also the leader, albeit with a smaller share, in China. In the US the top two usage brands, Apple and Samsung (005930.KS), represent 80.6% of tracked website traffic, a grater share than the combined total (top 5) share in all other countries and over 50% of the worldwide share. When averaging brands across the five countries (unweighted) Apple still maintains the greatest share (20.1%), followed by Samsung (14.1%), Xiaomi (1810.HK) 11.1%), Vivo (pvt) (10.9%), and Unknown (9.9%). Without Unknown, 5th place went to Oppo (pvt) (9.3%).
- Penetration
- Mobile vs. Desktop
- Connection Frequency
- Content Consumption
- Focus for Advertising
The US has the most brand loyalty, with Apple (AAPL), the top brand with a 57.6% usage penetration, more than twice the leader in any other country, and is also the leader, albeit with a smaller share, in China. In the US the top two usage brands, Apple and Samsung (005930.KS), represent 80.6% of tracked website traffic, a grater share than the combined total (top 5) share in all other countries and over 50% of the worldwide share. When averaging brands across the five countries (unweighted) Apple still maintains the greatest share (20.1%), followed by Samsung (14.1%), Xiaomi (1810.HK) 11.1%), Vivo (pvt) (10.9%), and Unknown (9.9%). Without Unknown, 5th place went to Oppo (pvt) (9.3%).
While the absolute share for each brand changes slightly each month, real changes in usage brand share take time as can be seen in XXX below. Standouts are Samsung (Upper Orange line), who has been losing share since 2023 and Huawei (Light Blue)who, under US trade sanctions, has been losing share since 2020. Overall, during the 5-year period those who lost share were Samsung, Huawei, LG (), Nokia (), Lenovo (), Sony (SNE), and ASUS (), while those that gained share were Apple, Xiaomi, Oppo, Vivo, Motorola (), RealMe (pvt), OnePlus (), Tecno (), and Infinix (). We note that only one Chinese brand has been in the loss column (Husaei) while other than Apple, all the gainers were Chinese brands.
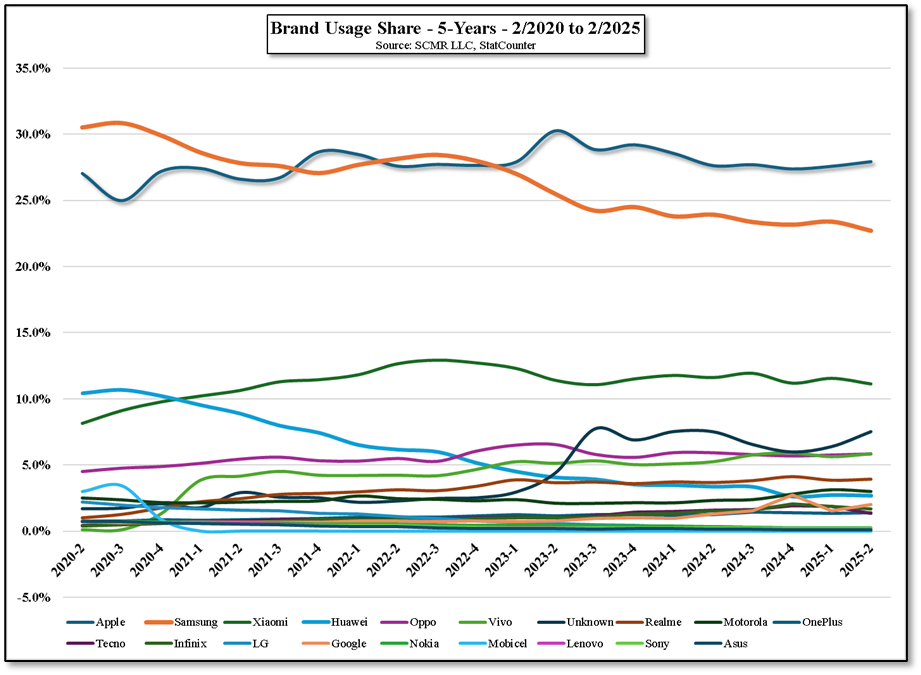
Figure 1 - Brand Usage Share - 5-Years - 2/2020 to 2/2025 - Source: SCMR LLC, StatCounter
 RSS Feed