Universal Display – Syzygy
We have been following Universal Display (OLED) for over 10 years, and spend a great deal of time on the OLED space. Rarely have we had the opportunity to use the word ‘Syzygy’, an ancient Greek word used to describe a straight line configuration of three celestial bodies, but we use it to describe the 1st quarter results at UDC, as everything aligned to create what is probably the best quarter in the company’s history. Yes, there have been those times when OLED TVs were released, or when Samsung Display (pvt) or LG Display (LPL) signed long-term agreements with UDC, but not when the numbers added up as they did in the 1Q results. So…
Revenue was 65% above consensus and EPS was $0.22 against a $0.00 consensus, so there was no question that things went far better than expected in the quarter, but most important were material sales, as noted in Fig. 1. Emitter sales are the lifeblood of UDC, and while the on a broad basis they have been improving, in 2016 they had become somewhat stagnant, with only modest growth. In particular we focus on red emitter, which is used in all small panel OLED displays, and should mirror the growth of small panel OLED capacity. Yes, there are lots of factors that can affect the quarterly use of red emitter material, but growth is what the OLED industry is all about, and there was little last year, despite the consistent tech headlines about the rapid growth of the industry. That was not the case in 1Q ’17, as red emitter reached the highest level in the company’s history and resumed the growth path that began a few years back.
There have been lots of reasons why red emitter varied from what should have been a steady growth rates, and we would be happy to discuss them all with investors on request, but there was no reason to cite those reasons in 1Q, as the two largest OLED producers ordered both red and green emitter materials in quantities that reflect the growth of the industry. We expect that we will hear, “They could have ordered too little in 4Q”, or “They probably over-ordered in 1Q”, but the point is that material sales were significantly better than expected. The harder question is why were they better than expected?, and technically that answer is not known, even by Universal Display, as they ship materials to their customers, who do not disclose to what fab or to what product the material is headed, but there are some factors that could have made a difference.
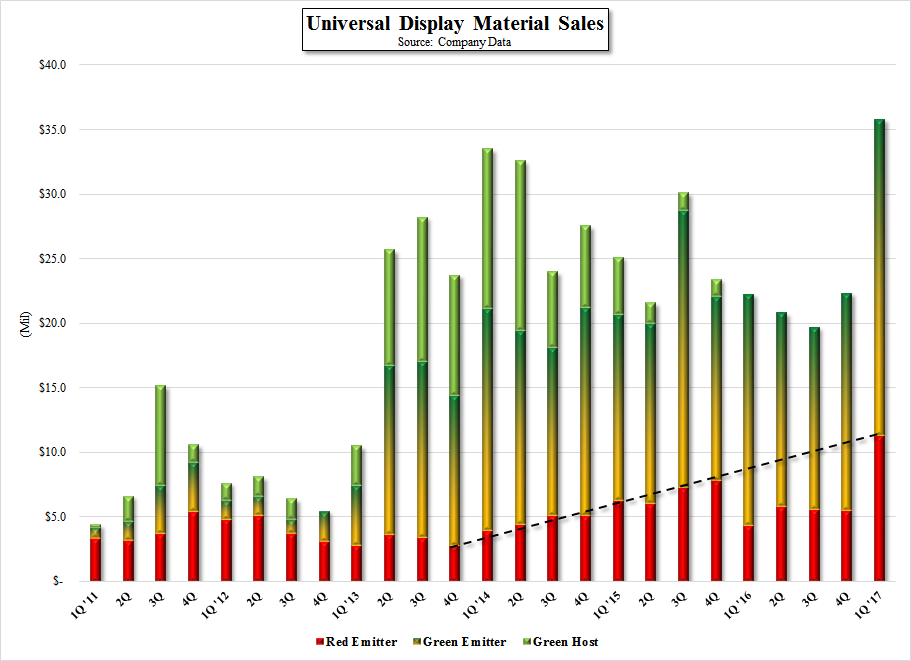
Universal Display Material Sales - Source: Company Data
Capacity Expansion – We have heard it before…as OLED capacity expands, material sales should increase, but it doesn’t seem to work that way in reality, and our OLED industry model, which was designed to be predictive, has been wrong for the last year. We even factor in variables as to how fast OLED producers are able to ramp actual production once they turn on a particular line or fab, which can be very different than assumptions that consider only stated capacity, and we still came up with material sales that were above UDC’s reported numbers in 2016. So is there a fundamental disconnect between OLED capacity expansion and the use of emitter materials? Yes, as there are a number of variables that can affect the ramp of an OLED line or fab, as noted, but we do not believe they were responsible for the relative weakness in emitter sales growth last year. Fabs are being built and products produced, and while expansion is not quite as linear as investors would like, they should be using more emitter material. They did in 1Q, as UDC saw not only an increase in emitter dollar value, but an increase in the number of kilograms shipped, which is more significant. But if capacity expansion should be the driver for OLED emitter growth, it should have driven emitter sales, particularly red emitter in a more linear manner for the last year.
Producer Efficiency – OLED emitter materials are expensive, and OLED display producers are always looking for ways to reduce that cost. Finding OLED stack combinations that use less emitter but can produce the same results is an ongoing goal for panel producers. Further, the methods currently used for depositing OLED materials on substrates are inefficient, with much of the material being wasted in the process. Making improvements in deposition efficiency should have an effect on emitter sales, and we factor those variables into our model also, but most improvements in OLED process tool efficiency would come as new lines are added and more efficient tools are used, and upgrading existing lines tends to be problematic for producers who are running at near or full capacity. We believe that producer efficiency has been a factor in containing emitter growth, but has not been the key factor in the relative flatness of UDC’s emitter sales last year.
Material Discounts – While sounding onerous, UDC gives its emitter material customers discounts based on volume. There are a number of dollar volume trigger points that lower the per gram price of the emitters as OLED producers ramp production. These discounts play an important part in UDC’s material sales numbers as they can offset increased material usage. We note also that while UDC develops new emitter and stack materials all the time, and presents them to customers, those customers do not change their stack formulations easily, as such changes could mean fab downtime, temporary yield degradation, or requalification of a product by the brand customer. But new materials have a distinct benefit to UDC as they ‘reset’ the discount timeline, and return emitter ASP’s to pre-discount levels. While we also build this into our OLED industry model, the adoption of new materials has a very significant effect on sales, and we believe that much of the stagnation seen in last year’s emitter growth was a result of delays in the adoption of new emitter materials by a major customer.
We believe that a major customer made a backplane change, and adopted new emitter materials at the beginning of this year, and as capacity using the new materials increases, there is an increase in UDC’s emitter sales as the ASP resets. We believe this is a significant part of the incremental emitter sales improvement seen in the 1st quarter’s results, particularly as the product attached to the new materials is a high volume product that has been in pre-release production since the beginning of the year. As the product sells, we expect the new materials to begin to reach some of the material discount trigger points, which will lower material ASP’s, but as said UDC customer builds new capacity this year, we would expect the new emitter materials to be adopted for those fabs, with the increased volumes offsetting the material discounting. We note that the volume of green emitter material is higher than red in a typical RGB OLED display and thus moves more quickly down the discount timeline.
What about Royalty & License?
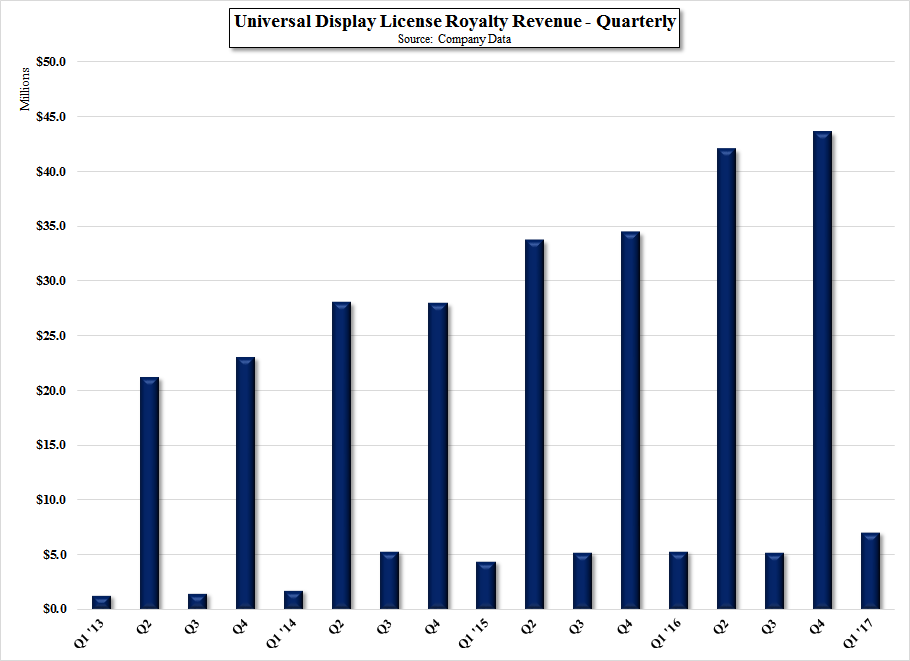
In theory, license and royalty revenue should be a secondary indication of OLED industry growth, but in the case of UDC, it has a few variables. First, the agreement UDC has with Samsung Display is based on escalating fixed license payments, and does not reflect unit volume royalties. This distorts the License/Royalty revenue line as Samsung’s payments occur in 2Q & 4Q each year (Fig. 2), so we represent the data without Samsung’s fixed royalty/license payments in Fig. 3, which shows a more linear progression. That said, the components of the License/Royalty line are both ‘sign-up’ license payments from a variety of potential OLED producers, both in display and OLED lighting, which enable those producers to use UDC materials in R&D and development projects, and actual royalty revenue. The true royalty revenue is generated primarily by LG Display, whose agreement with UDC calls for a unit based royalty on OLED products being sold by LG Display to brand customers. This royalty is reported on a 1 quarter lag basis, so the royalty from LG Display seen in the 1Q ’17 quarter is based on sales from 4Q 2016. We don’t discount the fact that other producers might also be generating unit based royalty revenue for UDC, but we believe LG Display is the bulk of that income segment.
The chart with Samsung license removed (Fig. 3) shows the steady progression of increasing license/royalty revenue, and while a specific breakdown is not given, should indicate that both new initial licensees have been added over the last four years, and that unit volume royalties are being generated as commercial OLED product (other than Samsung’s) are sold. There is one variable that does affect the royalty line growth, and that is unit volume pricing. The unit volume royalty is calculated on the transfer price of an OLED display as it leaves the LG Display factory. Each product type (smartphone display, TV display, Watch Display) and each product has a different transfer price, all of which vary according to brand negotiations and market demand, which makes estimates for unit based royalties a moving target, both for the analyst community and UDC, who receives an accounting from customers roughly 60 days after the quarter ends. The royalties generated can therefore be affected by mix, OLED panel pricing, and volume negotiations, all of which have to be built into royalty models. That said, as long as the trendline is up, it should indicate the expansion of the OLED industry and increasing royalty revenue for UDC, which it is shown in Fig. 3.
Producer Efficiency – OLED emitter materials are expensive, and OLED display producers are always looking for ways to reduce that cost. Finding OLED stack combinations that use less emitter but can produce the same results is an ongoing goal for panel producers. Further, the methods currently used for depositing OLED materials on substrates are inefficient, with much of the material being wasted in the process. Making improvements in deposition efficiency should have an effect on emitter sales, and we factor those variables into our model also, but most improvements in OLED process tool efficiency would come as new lines are added and more efficient tools are used, and upgrading existing lines tends to be problematic for producers who are running at near or full capacity. We believe that producer efficiency has been a factor in containing emitter growth, but has not been the key factor in the relative flatness of UDC’s emitter sales last year.
Material Discounts – While sounding onerous, UDC gives its emitter material customers discounts based on volume. There are a number of dollar volume trigger points that lower the per gram price of the emitters as OLED producers ramp production. These discounts play an important part in UDC’s material sales numbers as they can offset increased material usage. We note also that while UDC develops new emitter and stack materials all the time, and presents them to customers, those customers do not change their stack formulations easily, as such changes could mean fab downtime, temporary yield degradation, or requalification of a product by the brand customer. But new materials have a distinct benefit to UDC as they ‘reset’ the discount timeline, and return emitter ASP’s to pre-discount levels. While we also build this into our OLED industry model, the adoption of new materials has a very significant effect on sales, and we believe that much of the stagnation seen in last year’s emitter growth was a result of delays in the adoption of new emitter materials by a major customer.
We believe that a major customer made a backplane change, and adopted new emitter materials at the beginning of this year, and as capacity using the new materials increases, there is an increase in UDC’s emitter sales as the ASP resets. We believe this is a significant part of the incremental emitter sales improvement seen in the 1st quarter’s results, particularly as the product attached to the new materials is a high volume product that has been in pre-release production since the beginning of the year. As the product sells, we expect the new materials to begin to reach some of the material discount trigger points, which will lower material ASP’s, but as said UDC customer builds new capacity this year, we would expect the new emitter materials to be adopted for those fabs, with the increased volumes offsetting the material discounting. We note that the volume of green emitter material is higher than red in a typical RGB OLED display and thus moves more quickly down the discount timeline.
What about Royalty & License?
In theory, license and royalty revenue should be a secondary indication of OLED industry growth, but in the case of UDC, it has a few variables. First, the agreement UDC has with Samsung Display is based on escalating fixed license payments, and does not reflect unit volume royalties. This distorts the License/Royalty revenue line as Samsung’s payments occur in 2Q & 4Q each year (Fig. 2), so we represent the data without Samsung’s fixed royalty/license payments in Fig. 3, which shows a more linear progression. That said, the components of the License/Royalty line are both ‘sign-up’ license payments from a variety of potential OLED producers, both in display and OLED lighting, which enable those producers to use UDC materials in R&D and development projects, and actual royalty revenue. The true royalty revenue is generated primarily by LG Display, whose agreement with UDC calls for a unit based royalty on OLED products being sold by LG Display to brand customers. This royalty is reported on a 1 quarter lag basis, so the royalty from LG Display seen in the 1Q ’17 quarter is based on sales from 4Q 2016. We don’t discount the fact that other producers might also be generating unit based royalty revenue for UDC, but we believe LG Display is the bulk of that income segment.
The chart with Samsung license removed (Fig. 3) shows the steady progression of increasing license/royalty revenue, and while a specific breakdown is not given, should indicate that both new initial licensees have been added over the last four years, and that unit volume royalties are being generated as commercial OLED product (other than Samsung’s) are sold. There is one variable that does affect the royalty line growth, and that is unit volume pricing. The unit volume royalty is calculated on the transfer price of an OLED display as it leaves the LG Display factory. Each product type (smartphone display, TV display, Watch Display) and each product has a different transfer price, all of which vary according to brand negotiations and market demand, which makes estimates for unit based royalties a moving target, both for the analyst community and UDC, who receives an accounting from customers roughly 60 days after the quarter ends. The royalties generated can therefore be affected by mix, OLED panel pricing, and volume negotiations, all of which have to be built into royalty models. That said, as long as the trendline is up, it should indicate the expansion of the OLED industry and increasing royalty revenue for UDC, which it is shown in Fig. 3.
Universal Display License/Royalty Revenue - Source: Company Data
There is a caveat here, as the long-term license agreement that UDC has with Samsung Display, their largest customer, ends at the end of the year. Obviously both parties have a significant stake in renewing, extending, or updating a new agreement, but there is no indication as to whether such negotiations will wind up with fixed license/royalty payments as it has been, or whether they will switch to a unit based royalty as UDC’s other clients use. These license/royalty negotiations will be critical to UDC’s financials in 2018 and beyond and the accompanying material supply agreements, albeit heavily redacted, will also be key to UDC’s material sales. While the current contract negotiations took at least 18 months, we would expect if a new agreement is not reached by year-end, the current agreement will be extended until final negotiations are concluded, with little short-term impact. That said, any substantive change in the important terms of an extended agreement, particularly a change in the royalty method, would have a significant impact on UDC’s quarterly revenue volatility.
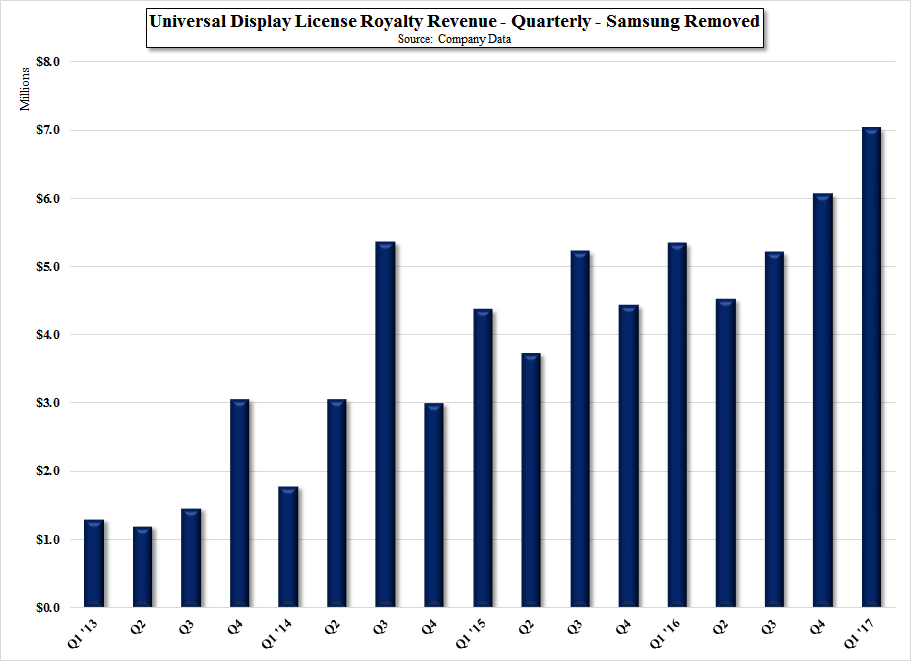
Universal Display License/Royalty Revenue - Samsung Removed - Source: Company Data
There are many issues that affect the OLED industry and UDC as a primary supplier and IP holder, but after years of anticipating how the growth of the technology would show up in UDC’s results, we would like to bask in the sunlight for at least a moment before dealing with the inevitable puts and takes of the display business, and we ask Kim Jong-un to hold off for at least the weekend before escalating tensions on the Korean peninsula, the source of ~86% of UDC’s revenue.
“I love it when a plan comes together” – Col. John “Hannibal” Smith – The A Team
“I love it when a plan comes together” – Col. John “Hannibal” Smith – The A Team
 RSS Feed