Most Popular Smartphones – 2020
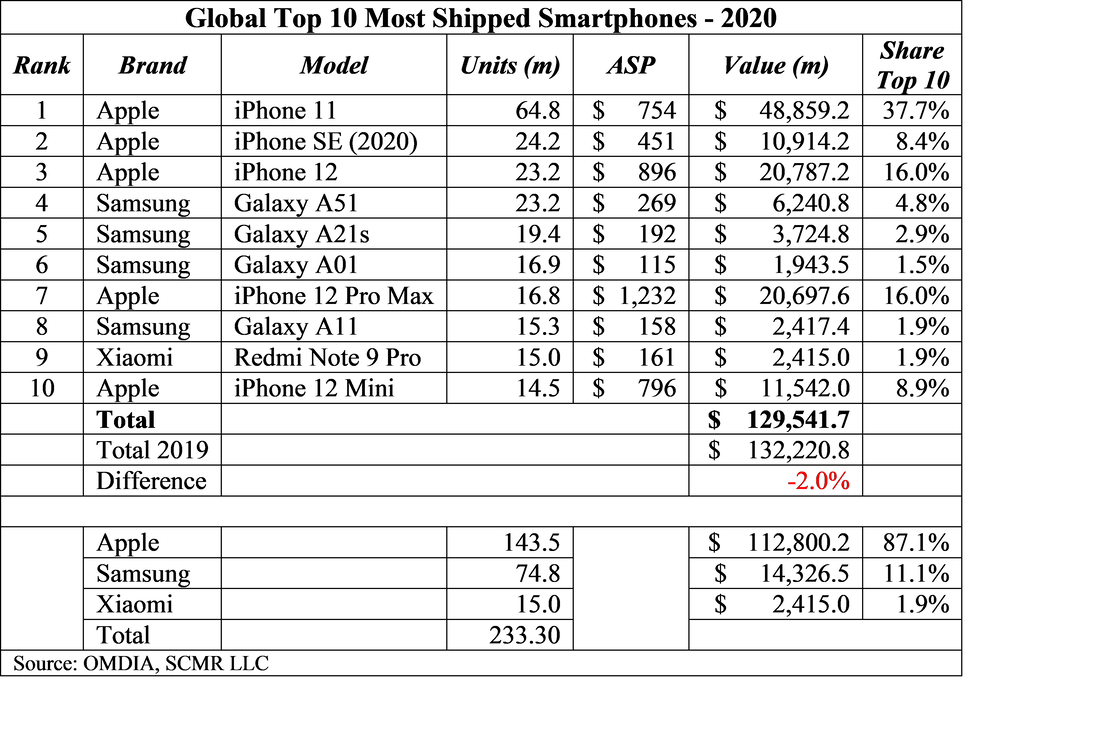
The world loves their smartphones, but which smartphones does it love the best? OMDIA (formerly IHS) says, based on shipments, Apple (AAPL) took 5 of the top 10 spots last year, followed by Samsung (005930.KS) with 4 and Xiaomi (1810.HK) capturing 1 spot, and while the values are different from those in 2019, the number of models for each brand was the same in 2019. The total value of the top 10 was down 2.0% from 2019, but the shipment value share was almost exactly the same, giving Apple the lead in both units shipped and value in both years.
One interesting difference between the two leaders is their pricing strategy, with Apple still pursuing a premium price customer, while Samsung’s best performance is with mid and lower tier phones. The weighted average (brand units – top 10 only) ASP for Apple in 2020 was $786.06, while that of Samsung was $191.53, a very obvious difference. Last year the same calculations revealed an $864.14 weighted ASP for Apple and a $157.97 ASP for Samsung, however Apple saw top 10 shipments increase, while Samsung saw top 10 shipments decrease, which hints at the increasing contribution of the lower-priced iPhone SE for Apple. While we don’t expect Apple to make significant changes to the base price of the top of the iPhone line this year, we expect they will continue to offer a mid-priced iPhone, be it a new iPhone SE or a similarly priced device.
Samsung’s disappointing Galaxy Flagship smartphone results last year will likely push the brand toward changing its high-end structure, with the elimination of the Note series and the addition of new foldables as Note replacements, which will likely increase the high-end ASPs. This leaves Samsung more able to battle in the mid and lower price tiers, where it has had success, but much will depend on the success of the additional foldables, which are still a bit of a novelty with consumers. If Samsung is able to begin to replace the Note line with foldables and not lose ground in the mid-tier, their overall ASP should increase again this year.
 RSS Feed