OLED S/D
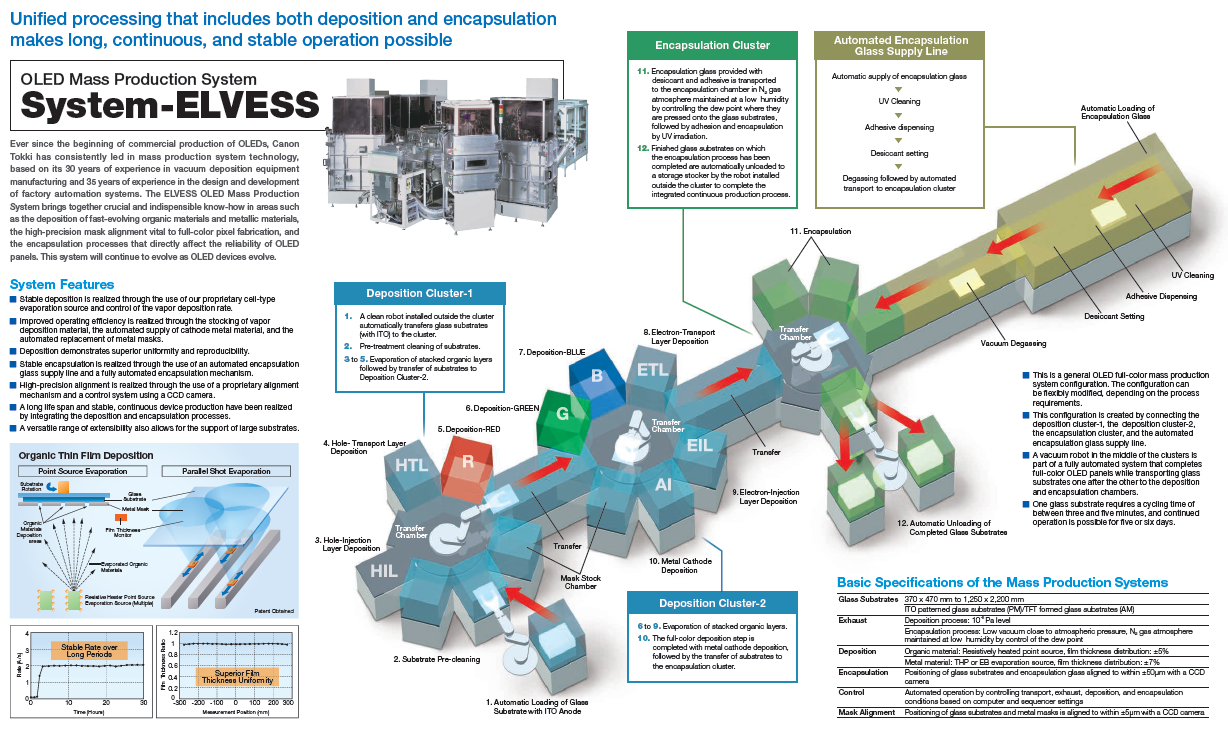
One issue that remains however, is the need for such capacity, and while each small panel OLED producer is focused on existing and potential customers and their ability to meet customer demands, the net increase in capacity is of a more direct concern to us as an observer of the industry, and the utilization rate of that capacity is key. While ‘adding 16,000 sheets/month’ is what might be noted by a panel producer, 16,000 sheets do not usually come on line all at once. OLED lines are based on both the TFT component, where circuitry that sits under each pixel is constructed, and the deposition of the OLED structures themselves, accomplished within a multi-chamber evaporative deposition tool (see Fig. 1), followed by an encapsulation process that is either part of the same tool or a separate process step.
The Canon tool shown in Fig. 1 can process a substrate sheet (usually ½ sheet) in ~5 mins., which is over 90 6.5” smartphones. Such a tool should be able to operate continuously for ~6 days, producing roughly 600,000 units/month including down time, particularly chamber cleaning and mask replacement and alignment. Since each deposition tool processes ½ substrate, two such tools are needed to match the processing capabilities of the TFT structures in order for there to be no bottlenecks. Equipment supplier backlog and build times for such tools are a consideration for OLED panel producers, so a line with 15,000 sheet stated capacity, might begin operation at half that rate until both deposition tools are operating at their target rate. The equipment utilization rate, or the percent of a line’s equipment that is in operation, is different from the line’s yield, which is a bigger determinant as to actual production, and the above numbers assume 100% product yield, which is a theoretical number.
Product yield varies with each product and is initially low, especially with products that differ from previously produced displays. Much fab equipment is dedicated to examining displays coming off the line, both optically and electrically, with the objective to trace back yield issues to the source, but such iterations can take time and are not always easy to correct given the complexity of the tools involved. Product yield issues can keep an OLED fab from profitability for an extended period of time depending on the experience of the producers, and while the stated capacity of the fab might be 30,000 sheets/month, the yielded capacity can be far less.
The last contributor to fab output is customers. The cost of producing OLED displays is high enough (the deposition tool mentioned above cost between $100m and $150m each) that small panel OLED producers tend to produce against customer orders and do not want to build unallocated inventory unless they see demand from distributors, or significant demand from parent or internal subsidiaries, but even the latter can leave the fab with excess inventory if parent demand changes, so again, while a fab might be able to produce 30,000 sheets/month, there are many reasons why that number tends to be more theoretical than actual. More mature small panel OLED fabs, during periods of strong demand, can and do see high utilization and high product yield, but we have and continue to caution investors that stated capacity does not mean yielded capacity, and yielded capacity is what makes such fabs profitable.
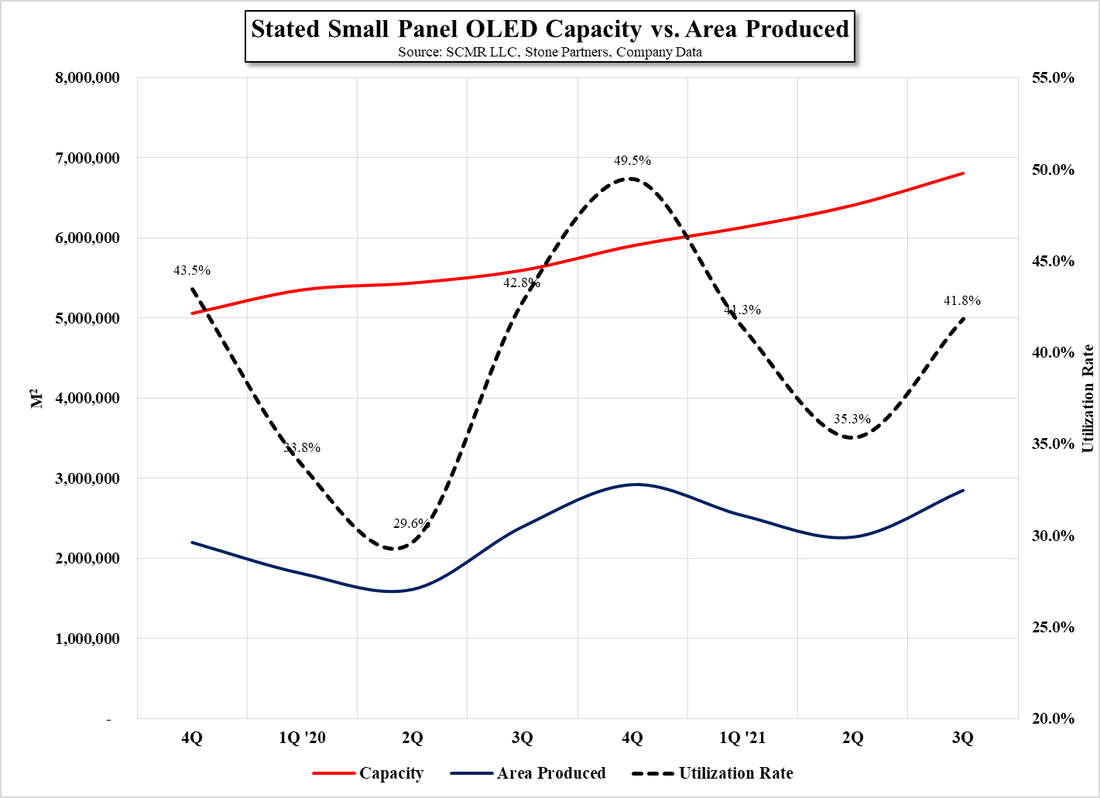
Based on our data, we believe the small panel OLED industry saw a utilization range between 29.6% and 49.5% over the last 8 quarters, and while that would be considered low in comparison to LCD production fabs, with the continuation of small panel OLED capacity expansion, relatively easy capital sourcing in China, and seasonal demand patterns, it is not surprising, but it does beg the question, “Does the industry need all of that new capacity?”
There are a few other factors that play into such calculations, individual or otherwise, such as conversions of existing small panel OLED fabs from LTPS (Low Temperature Poly-Silicon) to LTPO (Low Temperature Poly-Crystalline Oxide), which affects the TFT portion of fab throughput, and LG Display’s (LPL) loss of its parent’s smartphone business, but even with expanding demand from OLED notebooks and similar new applications, the desire of some small panel OLED producers to gain share continues to push capacity expansion at a rate considerably higher than actual production, as noted in Fig. 2, leaving some suppliers facing losses in what has been a positive environment for small panel OLED displays.
As we have seen in the LCD space, there is no way that individual small panel OLED producers will be convinced that continued expansion is not the best objective and the concept that growth will continue forever will remain the driving force for such expansion, that is until demand plateaus are reached or questions concerning the profitability of smaller producers become foremost in the minds of funding sources. There is still demand expansion in the small panel OLED space with OLED displays now represent over 50% of all smartphone displays (see our note 11/22/21) but new markets develop slowly and any slowdown in small panel OLED area growth could puncture the expansion balloon, which, if rational behavior is not possible, could be a solution to the problem, albeit a less desirable one.


 RSS Feed