Real-world 5G
Carriers make many claims about 5G service, some of which are either misleading or downright false, however there are those that actually study the performance of such things in a real-world environment, with results that tend to be far more realistic than the general claims made by carriers. In downtown Minneapolis, a city that has been a leader in establishing 5G coverage, a study was done by The Signals Research Group in June of last year that focused on mmWave coverage in downtown Minneapolis to better understand what customers might experience when using the service.
The testers walked the route shown below and recorded uplink speed as they walked, with each colored dot representing a point at which a reading was taken. While we cannot plot the tower locations themselves, it is quite obvious that uplink speeds varied considerably, from 80Mbps to areas where 5G coverage disappeared completely. Given the sensitivity to obstructions, and therefore direction, the direction in which the smartphones were pointing (arrows) had an effect on performance, which would not be the case using sub6 bands, but this test was limited to mmWave only. As the key is not available we summarize the dot colors with black being no connectivity, red, yellow and green being 1Mbps to 10 Mbps, blues = 20Mbs to 40Mbs, and pinks and purple – 50Mbs and above.
As can be seen, the real-world results vary considerably, and while we expect 5G coverage has increased since the test, much of what would be added would be sub6 5G at lower speeds, less directional and varied coverage, and while this would point toward carriers building out sub6 5G over mmWave 5G for the general public. mmWave is obviously best suited for fixed installations where coverage is optimized and remains so at the site. Internal distribution of high bandwidth at such a location could be done in a variety of ways with internal uplink speeds determined by the internal system rather than the tower link, all in, a far better way to utilize the bandwidth and speed that mmWave supplies.
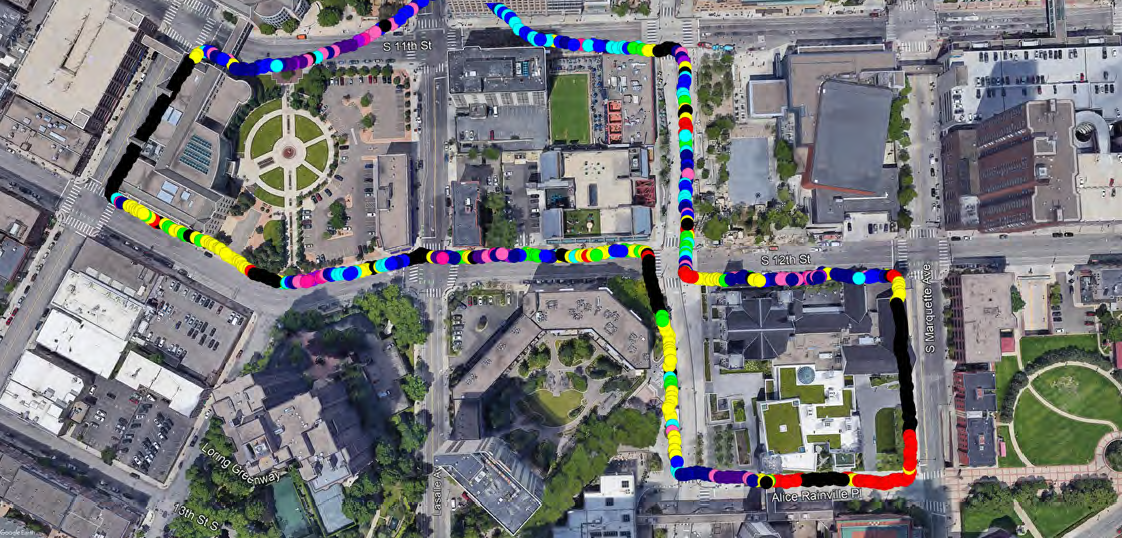
MmWave Walk-thru map - Minneapolis, MN - Source: Signals Ahead Vol II, June 2020
 RSS Feed