Tracking Mobile OLED Share
Weibo (WB) is always abuzz with glowing commentary concerning China’s prowess in the OLED space, with constant pointing to new fab capacity being brought on line weeks or months earlier than planned and Chinese branded smartphones sporting OLED displays with smaller camera cutouts or a camera that can take SLR quality pictures 3 feet underwater. We certainly don’t disparage these accomplishments but they tend to paint a picture of the global mobile OLED market that looks like the planting of the Chinese flag in the middle of Seoul, South Korea. Just to make sure we were not fooling ourselves, we went back to our OLED production data to see how much the balance between OLED producer share had changed over the last few quarters.
Rather than work from raw capacity data, which does not take into account whether the fab is running all of the installed lines, the utilization of the lines that are operating, and the line-by-line yield, we are starting with unit volume production data and breaking that down according to size. This gives a clearer picture of actual production in m2, rather than trying to make assumptions on the parameters just mentioned, particularly as panel producers are a bit loose on how they characterize production levels. In fact we recently received clarification on a statement from a Chinese producer who had stated that a new fab was ‘open at its stated capacity’, which after a bit more detailed questioning, turned out to be, ‘the fab is complete and is ramping production’, giving a far different perspective on actual production than the original statement.
Looking at the data in Fig. 1, which shows the unit production share for flexible OLED panels, it is obvious that Samsung Display (pvt) holds the greatest share, although it certainly has declined over the last five quarters, especially if the 2Q forecast turns out to be correct, deteriorating from 81.7% in 1Q 2020 to a forecasted 51.5% in 2Q of this year. Combining Samsung Display with LG Display (LPL), its South Korean rival and counterpart, their share of flexible OLED panel production declined from 90.3% in 1Q 2020 to (forecasted) 63.9% in 2Q 2021. At the same time the share of Chinese flexible OLED panel producers rose from 9.7% in 1Q ’20 to 36.1% in 2Q 2021, which begs the question, are the Chinese OLED panel producers right to boast about releasing the strangle hold South Korean OLED producers have had on the market?
Before we answer that question, there is another chart to look at. Fig. 2 depicts rigid OLED panel unit share over the same period, and while the basket of producers is the same as in Fig. 1, there are a number of major differences. First, LG Display produces almost no rigid OLED panels, nor does China’s largest display producer BOE (200725.CH), leaving the market essentially to Samsung Display, EverDisplay (688538.CH), and Tianma (000050.CH), with the latter two being Chinese OLED producers. Here again, Samsung Display’s share has declined from 93.5% in 1Q 2020 to 89.9% in 2Q, a far smaller decline than seen in flexible displays, but everyone knows that flexible displays are the most popular so the value of rigid OLED production is minimal, right?
Not really, and Fig. 3 shows that visually. This chart combines the unit data from flexible and rigid OLED production, and Samsung Display’s dominance is even more obvious here, although still dropping from 88.3% in 1Q 2020 to 71.1% (f) in 2Q 2021. But we still have not answered the question about flexible OLEDs being the more popular over rigid OLEDs. The data in the table below shows the share of the composite data as to both flexible and rigid area, and while rigid starts the period at a higher share, by the end of the period, they are almost evenly split and average only 0.6% apart. This belies the fact that flexible OLED displays are the more popular type, and while they capture the bulk of the press and a higher valuation, rigid OLED displays are the backbone of the mobile OLED space.
While there is certainly more nuance that can be derived from such data, China’s original premise, that they have ended the South Korean dynasty that has been ruling the OLED market since its inception is a bit premature, and with OLED display production for the iPhone 13 just underway, we would expect the South Korean share to rise for 3Q and 4Q, given that they are both the primary suppliers. That said, the Chinese government has not backed away from supporting the Mainland OLED production space with subsidies and tax incentives, while producers outside of China must rely on self-financing or the global financial markets and Chinese OLED producers have certainly not backed away from the challenge of becoming the dominant supplier for mobile OLED displays, but we expect it will take some time to reach a point where they can claim a truly dominant share. Raw capacity is important but filling that capacity is even more so.

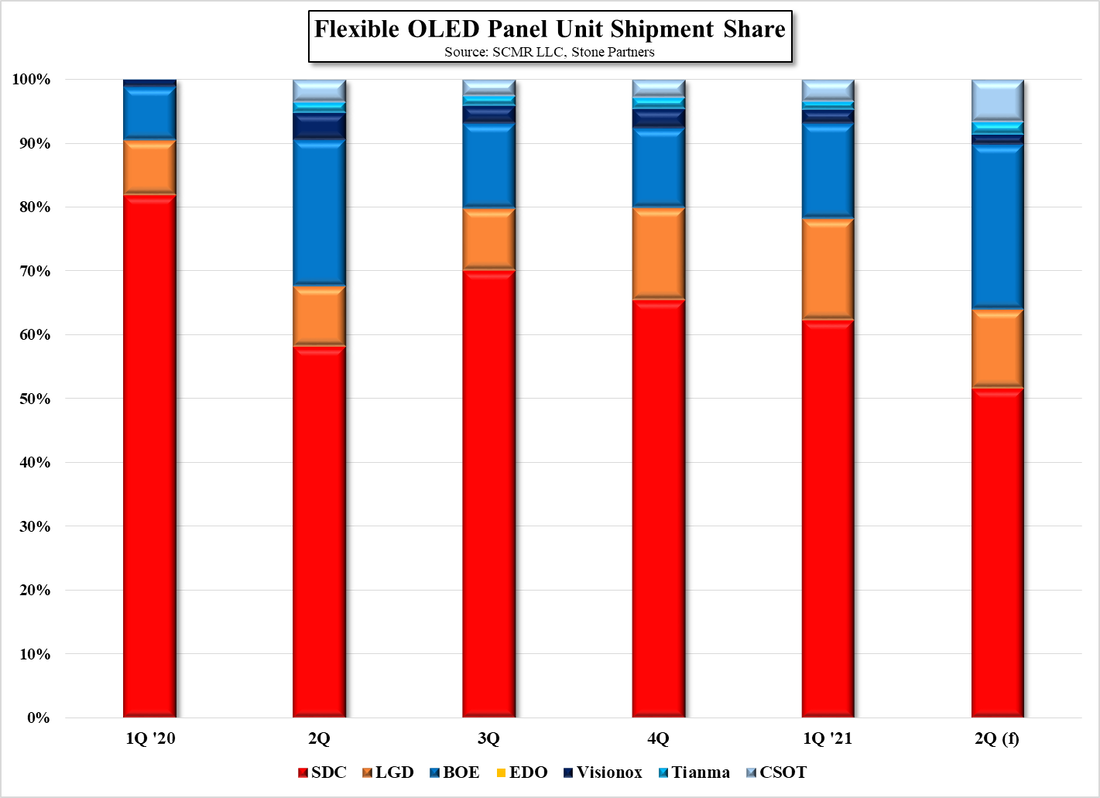
Flexible OLED Panel Shipment Share - Source: SCMR LLC, Stone Partners
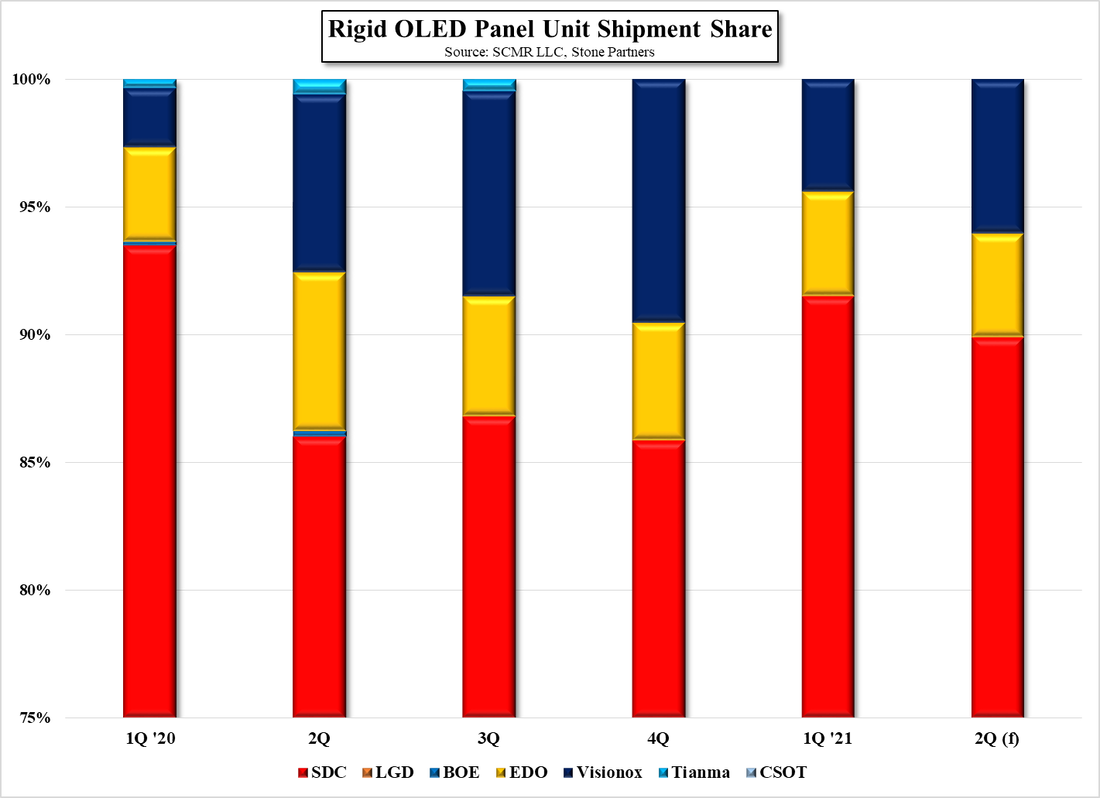
Rigid OLED Panel Unit Shipment Share - Source: SCMR LLC, Stone Partners
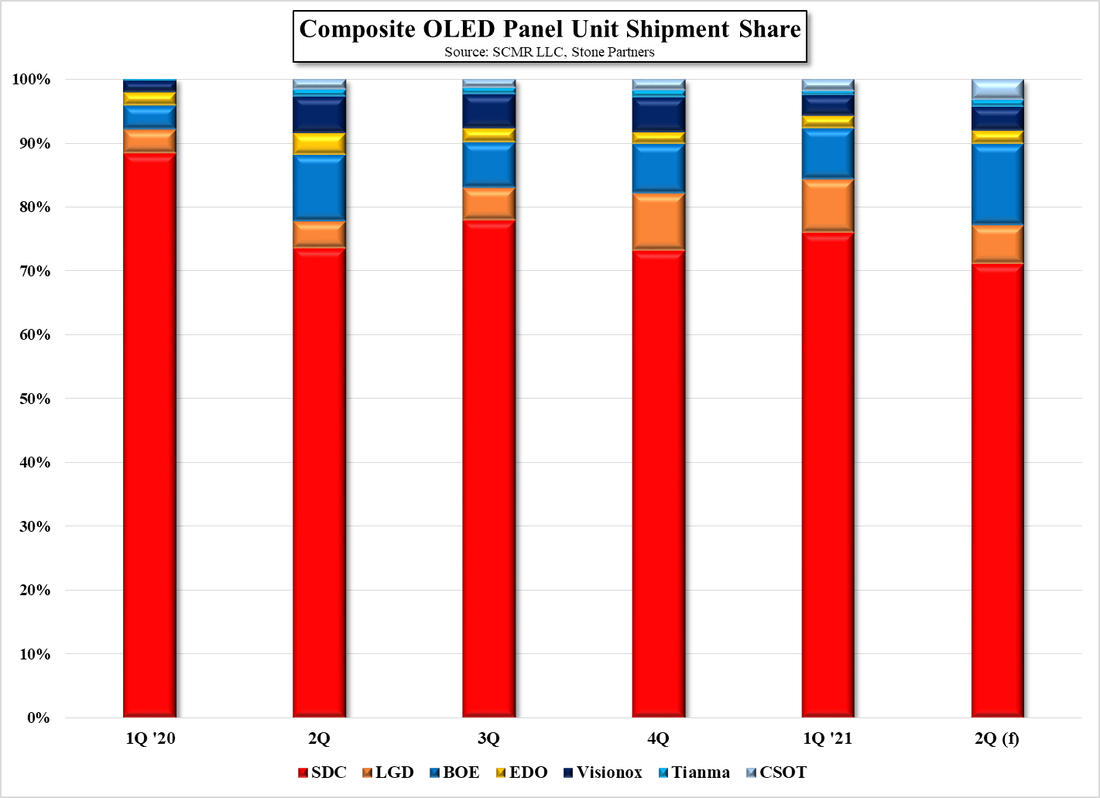
Composite OLED Panel Unit Shipment Share - Source: SCMR LLC, Stone Partners
 RSS Feed