July Panel Shipments & Sales
Given the fact that most CE devices have a display of some sort, and as the device category becomes more sophisticated the display tends to follow suit, and the display itself tends to be the single highest cost component in many CE devices. As an example, the cost breakdown of components in the Samsung (005930.KS) Galaxy Note Ultra 5G, one of Samsung’s flagship models that was released in August of 2020 had a component BOM of ~$468, and while the cost of the display included the 6.9” OLED screen, touch overlay, driver IC and cover glass, it was 19.6% of the component BOM, with only the entire cellular system, encompassing the 5G modem (both Sub6 and mmWave), 2G,3G, 4G systems and antenna modules costing more (20.8%), although we believe the display itself was still the largest share of the component BOM. As such the display market is a key indicator as to both short-term and long-term trends in the consumer electronics space and we have looked at and maintain data display sales and shipments on a monthly basis since 2004 to help in understanding the prospects for a wide variety of companies that feed the CE supply chain.
As the industry contracts after hitting a peak in July of last year, we watch for signs that those factors that caused or are causing the decline are gaining or losing ground in order to gain some insight into when a bottom in the display cycle might be reached and what the momentum on the up cycle might look like. The data, particularly charts, paint a picture that can give hints as to where the display industry will be in 3 months, six months, a year, or two years but the psychology behind what goes on in the display space is equally important and we try to provide an unbiased perspective to balance the data. When we speak with industry professionals we try to understand their way of thinking, which can be diametrically opposed to our perspective, but our goal is to read through the corporate speak, technical gobbledygook, and blind optimism that pervades the industry and figure out the root of the conversation and real answers to questions. We have no positive or negative bias toward the display space or the CE space as we get paid to provide information and not promote sponsored products, which we hope our readers understand and value. So much for shameless self-promotion…
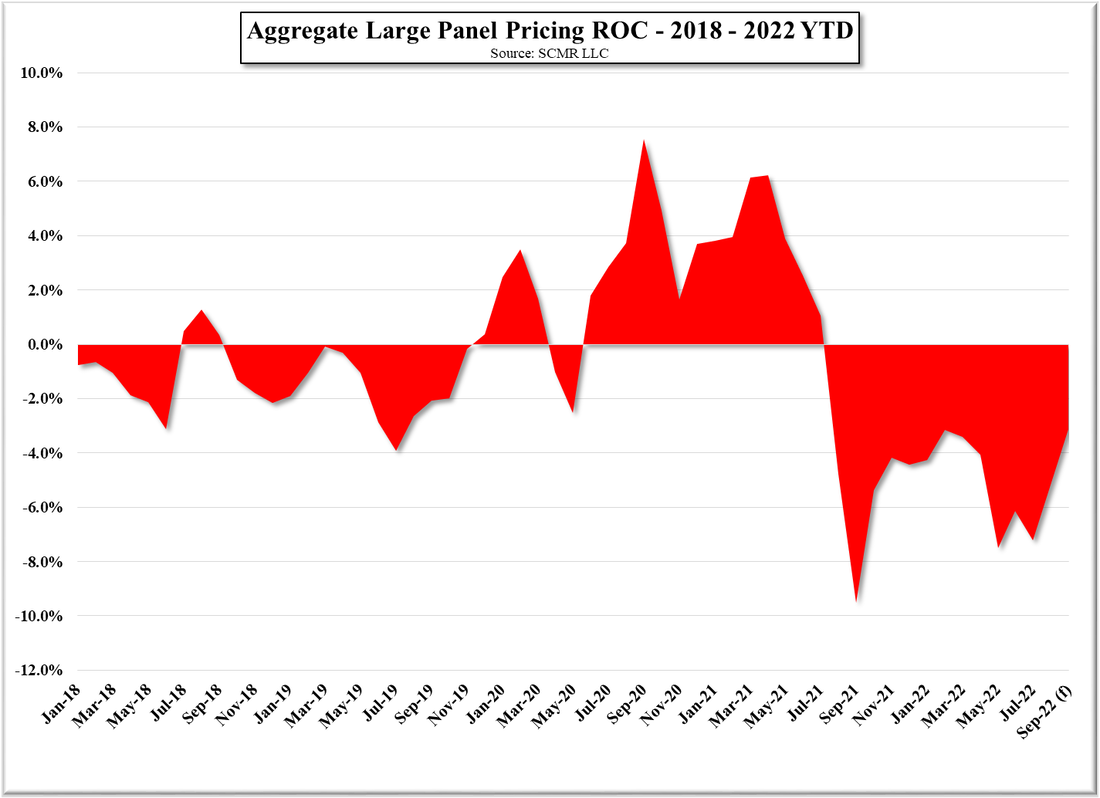
As we have noted, panel; producers finally began to realize that panel pricing was not going to go up forever and that what they hoped was going to be the ‘new normal’ was just another wave in a cyclical industry. As we noted yesterday panel producers have begun to lower fab utilization rates for a number of reasons. The first, demand has declined, and second, many panel prices have fallen below cash costs. As demand rose in 2020 and the 1st half of 2021, as COVID changed consumer habits, brands embraced that demand but held on to consumer momentum far longer than necessary, and coupled with an underlying fear of not having enough components to meet future demand, brands built inventories past normal levels. Now, with lower demand from consumers as COVID wanes and inflation rears its ugly head, those inventory levels are the third leg of the stool forcing producers to lower utilization levels to work down that inventory.
Panel producers began this process in May and have since lowered utilization rates from the low to mid 90% level to the mid 70% level and while in yesterday’s China LCD Production Utilization Chart we left July industry large panel sales flat, we now have added actual July data, which indicates that large panel sales in China decreased by 8.5% in July, giving some indication as to the effectiveness of the most recent utilization cuts in China. As China fabs generated 47.3% of total industry large panel LCD sales, the utilization cuts made on the Mainland have a significant effect on the global display supply situation, hence our focus on China during this part of the down cycle.
As the industry contracts after hitting a peak in July of last year, we watch for signs that those factors that caused or are causing the decline are gaining or losing ground in order to gain some insight into when a bottom in the display cycle might be reached and what the momentum on the up cycle might look like. The data, particularly charts, paint a picture that can give hints as to where the display industry will be in 3 months, six months, a year, or two years but the psychology behind what goes on in the display space is equally important and we try to provide an unbiased perspective to balance the data. When we speak with industry professionals we try to understand their way of thinking, which can be diametrically opposed to our perspective, but our goal is to read through the corporate speak, technical gobbledygook, and blind optimism that pervades the industry and figure out the root of the conversation and real answers to questions. We have no positive or negative bias toward the display space or the CE space as we get paid to provide information and not promote sponsored products, which we hope our readers understand and value. So much for shameless self-promotion…
As we have noted, panel; producers finally began to realize that panel pricing was not going to go up forever and that what they hoped was going to be the ‘new normal’ was just another wave in a cyclical industry. As we noted yesterday panel producers have begun to lower fab utilization rates for a number of reasons. The first, demand has declined, and second, many panel prices have fallen below cash costs. As demand rose in 2020 and the 1st half of 2021, as COVID changed consumer habits, brands embraced that demand but held on to consumer momentum far longer than necessary, and coupled with an underlying fear of not having enough components to meet future demand, brands built inventories past normal levels. Now, with lower demand from consumers as COVID wanes and inflation rears its ugly head, those inventory levels are the third leg of the stool forcing producers to lower utilization levels to work down that inventory.
Panel producers began this process in May and have since lowered utilization rates from the low to mid 90% level to the mid 70% level and while in yesterday’s China LCD Production Utilization Chart we left July industry large panel sales flat, we now have added actual July data, which indicates that large panel sales in China decreased by 8.5% in July, giving some indication as to the effectiveness of the most recent utilization cuts in China. As China fabs generated 47.3% of total industry large panel LCD sales, the utilization cuts made on the Mainland have a significant effect on the global display supply situation, hence our focus on China during this part of the down cycle.
On a global basis, as panel producers in other regions have also cut utilization, July global large panel sales were down 4.3% m/m and down 35.7% y/y to the lowest point since May 2020. July large panel shipments were down 12.1% m/m and down 16.9% y/y, and as shipments declined at a faster rate than sales, overall large panel ASP’s rose by 8.9% to $81.73, the first m/m increase since February. All product categories saw shipment declines as shown below. If we average the sales/month for this year, the reduction in sales between June and July would be the equivalent of 1.2 days of sales, a rather mediocre push toward reducing panel inventory, which we believe to be ~15+ days above normal, with some of that sales reduction from weaker overall demand. While we expect the additional cuts made this month will impact sales further in August and help the industry to absorb more than a day or two’s worth of inventory, our expectations for how long such utilization cuts might last are now extended into 4Q and beyond.

[1] Includes Notebooks, Monitors & Tablets
China - LCD Production Utilization Rates - Source: SCMR LLC, CINNO
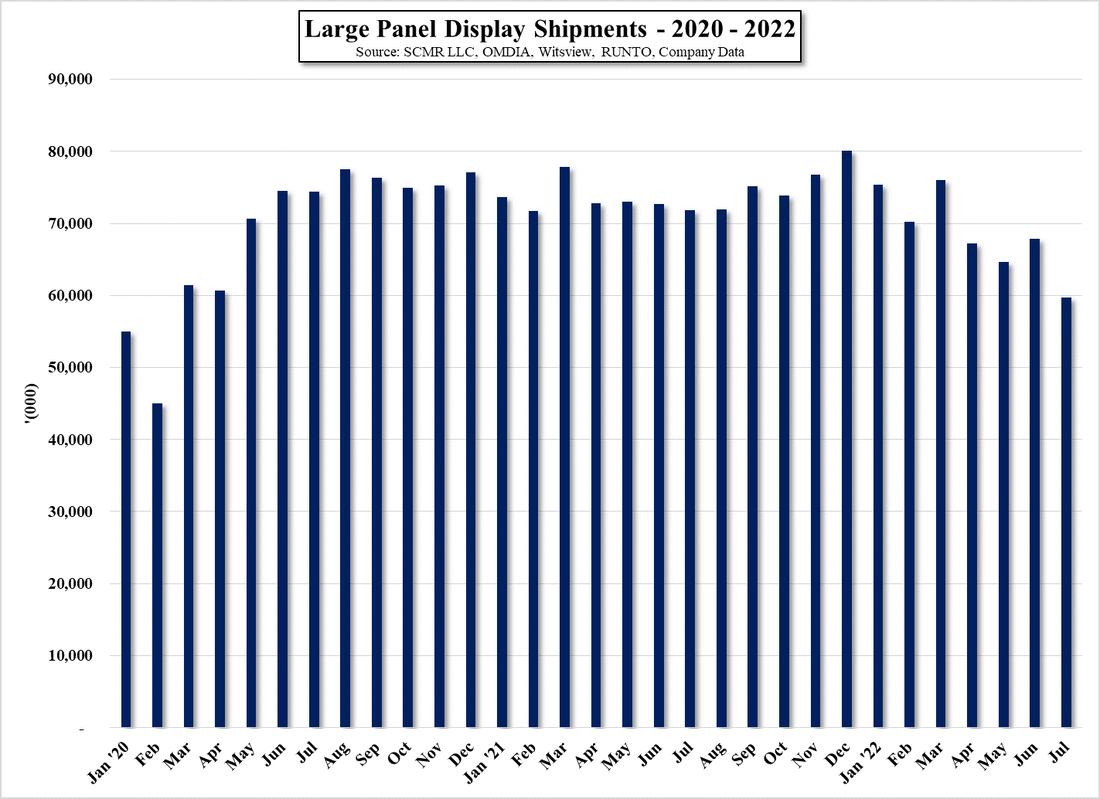
Large Panel Display Shipments - 2020 - 2022 - Source: SCMR LLC, OMDIA, Witsview, RUNTO, Company Data
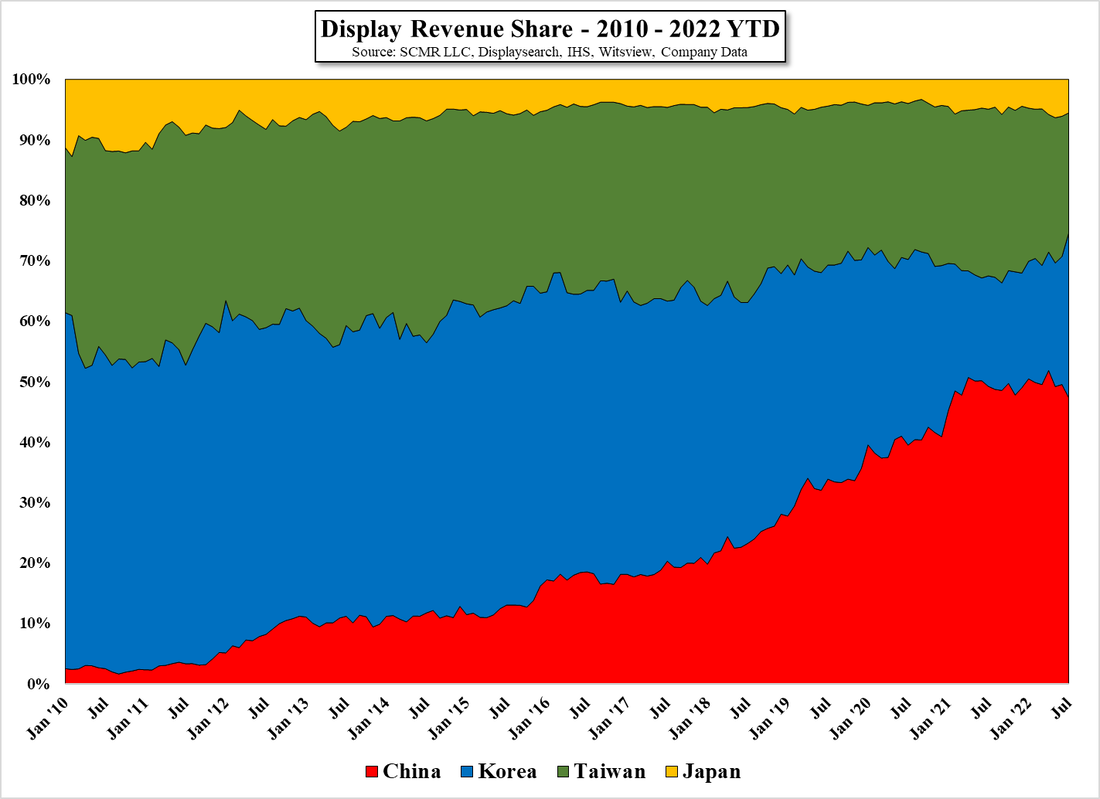
Display Revenue Share - 2010 - 2022 YTD - Source: SCMR LLC, IHS, Witsview, Company Data
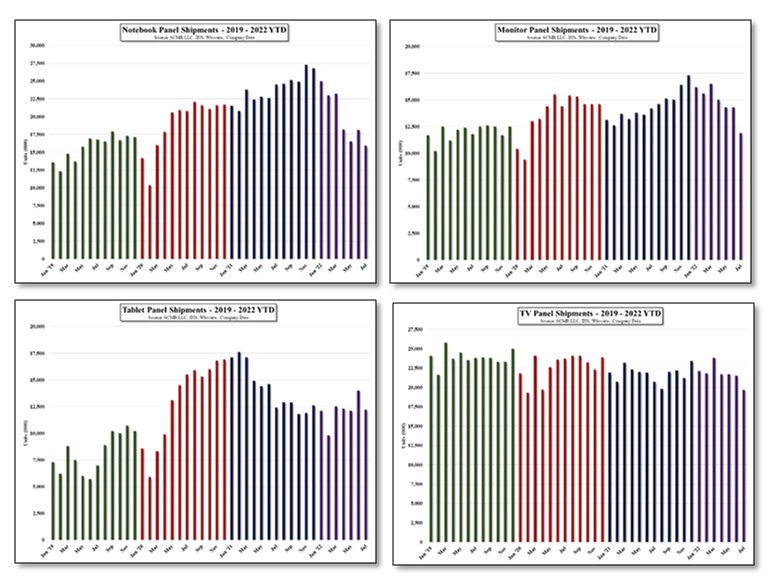
Panel Shipments - Notebooks, Monitors, Tablets, TV - Source: SCMR LLC, IHS, Witsview, RUNTO, Company Data


 RSS Feed