Supply Chain Market Research - SCMR LLC
  • Blog
  • Home
  • About us
  • Contact

No 8K in the EU…

9/27/2022

0 Comments


No 8K in the EU…
​

If new rules in the UK are not changed, starting in March of next year 8K and Micro-LED TVs will no longer be available to consumers in the EU.  A series of energy-related rules will come into effect next year that set energy use requirements for televisions with more than UHD resolution (8K) and micro-LED based displays as part of a larger ‘ecodesign requirement for energy related products’ program initiated in 2019.  When the guidelines were determined, 8K television sets were barely a notion, other than as demos at trade shows, so the specs were written (pre-2019 release) before there were a reasonable number of 8K sets available on which to make typical efficiency and power consumption calculations.  The 2023 rules require that 8K television sets must consume the same amount of power as 4K sets or would be unable to be sold in the EU.
Based on a quick check of Mini-LED/QD and OLED TVs, 8K TVs consume 90% more power than their 4K equivalents, with 8K OLED TVs coming in at ~77% higher and the 8K Mini-LED/QD sets coming in ~102% above their 4K counterparts.  A further look by the 8K Association, a group with an obviously big stake in the debate, has indicated that they find that no 8K television sets currently in the market would meet the new specifications.  The regulatory committee that has set the guidelines is supposed to meet before the end of this year to review the guidelines, although no meetings have been scheduled to date.
The problems facing 8K TV power requirements is simple to understand.  8K TVs have to fit 4 times as many pixels into the same space as 4K TVs, which means each pixel has to be smaller.  As the electronics that control each pixel remains basically the same size in both 4K and 8K, the area available for the backlight to pass through becomes smaller as a percentage of area in 8K pixels.  In order to compensate for the lower amount of light, the backlight in 8K sets needs to be brighter and therefore requires more power.  Additionally, given the increased number of pixels in 8K sets, the processing done for each pixel is also multiplied by 4, requiring more transistors and more power to drive them.
Those in the 8K ecosystem stand against the new regulations citing the effects on EU consumers who will no longer be able to avail themselves of the latest 8K content and will ‘fall behind’ other regions, although we are hard pressed to find a regional competition toward establishing 8K as the day-to-day television media format.  Japan has the only (state-sponsored) 8K broadcast station, usually reserved for important events, travelogues, and nature specials, and while there are streaming services that supply 8K content, 8K TV sales have not been stellar, with ~350,000 8K sets sold last year, a less than 1% share of the TV market, and Samsung Electronics (005930.KS) holding a ~65% share.
While we understand both sides of the 8K argument, the broadcast industry is still grappling with 4K while some streaming services charge extra for 4K, so pushing the television industry toward reducing power requirements for 8K TV does not strike us as a bad idea, although one that has relatively little relevance to consumers at least currently.  At some time in the future 8K will become germane to the industry but pressing the industry over a product that was developed way before it became useful to consumers will serve to push set producers to improve 8K set power consumption or abandon the product until there is at least some consumer demand.  We doubt there will be much consumer lament over ‘falling behind’ other regions in the world of television technology…
Picture
4K/8K Pixel Aperture Comparison - Source: SCMR LLC
0 Comments

Panel Prices –September – A Ray of Sunshine or False Hope?

9/26/2022

0 Comments


Panel Prices –September – A Ray of Sunshine or False Hope?
​

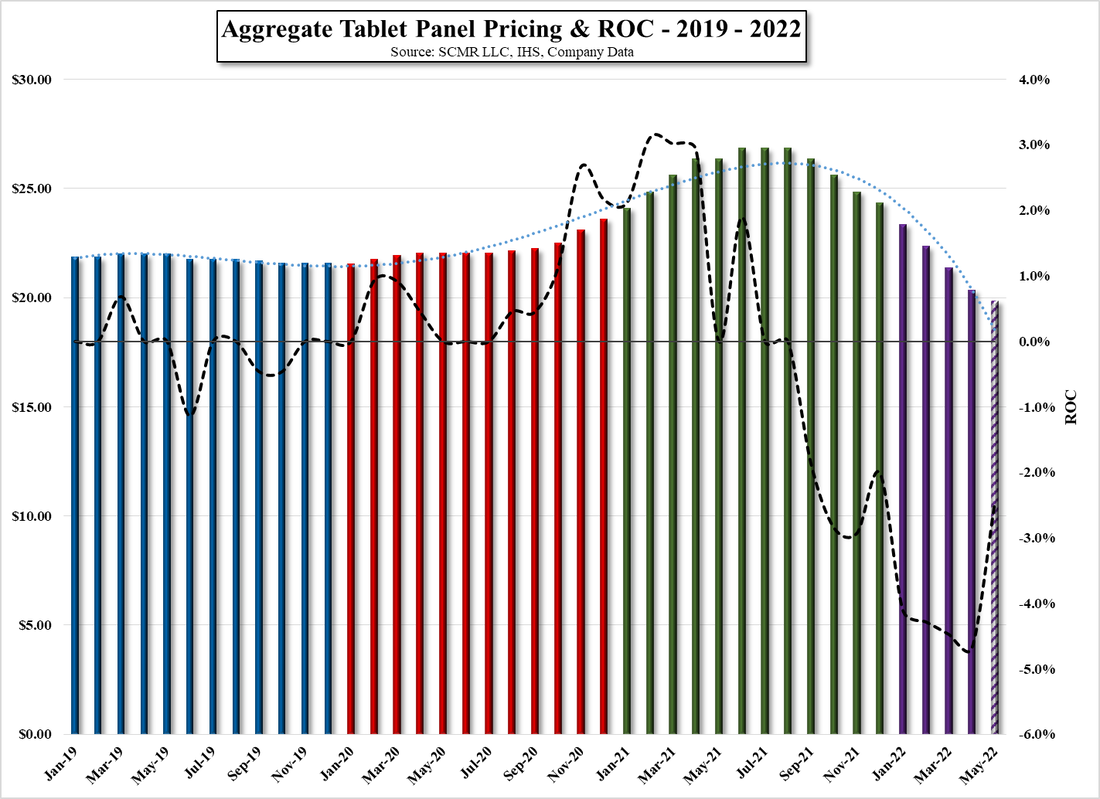
September panel prices offered a ray of sunshine in what has been a dark forest of depressed pricing across all panel categories.  While the shaft of sunlight is a thin one, as all categories (lg. panel, sm. Panel, tot. panel, IT panel, TV panel, Mon. panel, NB panel, Tablet panel, & Mobile panel) are all at their 3 year pricing lows, some solace can be taken in that the monthly rate of decline has been slowing, albeit still negative.  Perhaps as we get closer to the holiday season we are becoming more cheerful, but Figure 1 looks like it is getting close to the zero line, although a polynomial trend line (4th order) would take 6 more quarters to reach zero change.
There has been little change in the balance between buyers and sellers with buyers certainly having the upper hand, while sellers are trying, mostly unsuccessfully, to keep prices from falling further.  We expect there is some panel buying for Black Friday and the Chinese 11/11 holiday, but we temper our optimism with the global macro environment, which is doing little to stimulate consumer demand.  Given that panel prices are at lows and that there has been some relief on transportation and component costs, there is the possibility that as lower utilization rates allow existing panel inventory to be sold, there will be room for lower priced products to enter the market for the holidays, which could stimulate some bargain hunting, but we are still would not raise our expectations substantially for the remainder of the year as there remain considerable negatives on the horizon.
All in, September was slightly better than expected, mostly in the TV panel space, as it peaked and started its decline earlier than other categories.  Our modest sense of optimism, at least for October, is reflected in our October forecast, which portends a better (less negative) month across almost all categories.  We hope our optimism extends more than one month but we take it one day/week/month at a time. 
Picture
Picture
Aggregate Large Panel Pricing ROC - 2018 - 2022 YTD - Source: SCMR LLC
Picture
Aggregate Total Panel Pricing - 2021 - 2022 YTD - Source: SCMR LLC, OMDIA, Witsview, Stone Ptrs., Company Data
Picture
Aggregate Large Panel Pricing & Share - 2021 - 2022 YTD - Source: SCMR LLC, OMDIA, Stone Ptrs., Witsview, Company Data
Picture
0 Comments

Alternatives – Part II

9/26/2022

0 Comments


Alternatives – Part II
​

In order to meet the competition in the display space, panel producers must spend substantial sums to develop new technologies and processes and as timelines for the development and implementation of new display technologies grows shorter, risk levels increase.  Panel producers, in many cases are forced to pick a leading edge technology, sometimes before it has been proven to be feasible from a mass production standpoint, or take the approach of researching as many new display technologies as possible.  While both approaches carry considerable risk, there are only a select few that can take the later approach, as the cost of spreading R&D across a number of technologies yields little in terms of breakthroughs.  Large panel producers allocate between 7% and 8% of revenue to R&D while smaller producers allocate as much as 25+%, but the dollar values are so much smaller that the effect is negligible.  Samsung Electronics (005930.KS) spent $15.85b on R&D last year, and while that covers Samsung Display (pvt), the company’s semiconductor business, and all other segments. Smaller panel producer Visionox (002387.CH) spent 23% of sales on R&D, or $635m.
As we noted in Part I, historically, the display industry has tended to focus on one major technology advance at a time, which, when proven commercially viable, became the immediate focus for large panel producers and a later focus for smaller producers unless it happened to be one that the smaller producer had chosen as their ‘go to’ R&D project, such as Sharp’s (6753.JP) development of IGZO that resulted in its lead in the technology starting back in late 2012.  However, with the number of new potential display technologies being developed, and the potentially shorter timelines to a final mass production decision, the decision for smaller panel producers is more toward developing new product categories using existing infrastructure than it is developing new display technology.  In some cases the development of new product categories does entail new equipment or process changes, but most new product categories can be based on existing process lines or minor modifications, with more research done on the development of a marketing strategy and developing new customer relationships than leading edge technology.
The display industry has in the past categorized display panel products as ‘large’ and ‘small’, essentially categorizing large as panels over 10” (diagonal) and small as anything under 10”, with ‘large’ categories broken down into monitors, notebooks, and TV panels, and the ‘small’ category representing primarily feature phones (inexpensive with few features) and smartphones.  Over the years those categories became more defined, especially as OLED technology became a significant part of the ‘small’ category.  With the first LCD display on a phone appearing in 1994 (see Figure 5), LCD panel producers increased LCD display size, colors, and quality until OLED smartphones displays became a new category for ‘small’ displays back in 2005, although all small OLED displays were ‘rigid’ in that they were based on a glass substrate.  That changed in 2010 when Samsung Display released the 1st flexible OLED display used in the Galaxy Note Edge and only 4 years later when Samsung released the first commercial foldable smartphone display, the Galaxy Z Fold.
The timelines between these technology milestones continues to contract, which makes the R&D process even more critical to both large and small panel producers, with Figure 4 representing only small panel displays.  Large panel displays have undergone similar technology changes and now face a multitude of potential game changing display technologies that are at various stages of development toward commercialization.  With only a few panel producers able to spend the R&D dollars necessary to examine all of those potential display technologies, smaller panel producers are taking the ‘road less traveled’ and building out new display applications such as automotive or ultra high-resolution displays, especially as more generic panel categories see declining prices.  We expect this ‘bifurcation’ in the display space to continue as Samsung Display, LG Display (LPL), and BOE (200725.CH) push technological boundaries, and smaller panel producers more toward niche product development, with the pace of change in both regards, continuing to increase. 
In Part III we look at large panel display technologies, their timelines, and the new display technologies being developed.  Stay tuned
​
Picture
Small Display Technology Timeline - Source: SCMR LLC
Picture
The IBM Simon Personal Communicator - Released 1994 ($899 including 2 year contract) - Source:windmedia.org
Picture
Samsung Galaxy Note - Source: Samsung
Picture
Samsung Galaxy Fold - Source: Samsung
0 Comments

QD/OLED – Another Price Drop

9/26/2022

0 Comments


QD/OLED – Another Price Drop
​

​Samsung’s QD/OLED TV (55” model) has seen another price drop to a new low of $1599.99 ($1597.99 on Amazon (AMZN), putting it down 27.3% from its initial price of $2199.99, and its most recent price of $1791 on Amazon.  The 55” model has declined to $1699 recently, but has now eclipsed that low.  While the 65” model has declined 33.3% from its initial $2999.99 price on the Samsung website, we cannot verify any lower price on Amazon as it is available only through 3rd party sellers.
Samsung Display has been said to be increasing its QD/OLED yield, as we have previously noted, giving the company a bit more pricing flexibility and production volume so parent Samsung Electronics could be trying to increase volumes to make the QD/OLED line look more like a substantial part of the overall TV line, although our less optimistic scenario would be an excess inventory issues similar to what has been plaguing much of the CE space.  As a new product and one with which consumers are unfamiliar, we still question whether parent Samsung is ready to adopt the technology as a mainstream product, which will drive the decision making process at SDC as to whether they will begin to build out additional QD/OLED capacity, as we doubt without the full support of Samsung Electronics the decision to expand capacity would be made.
0 Comments

August Panel Shipments – “The Lady Doth Protest Too Much”

9/23/2022

0 Comments


August Panel Shipments – “The Lady Doth Protest Too Much”
​

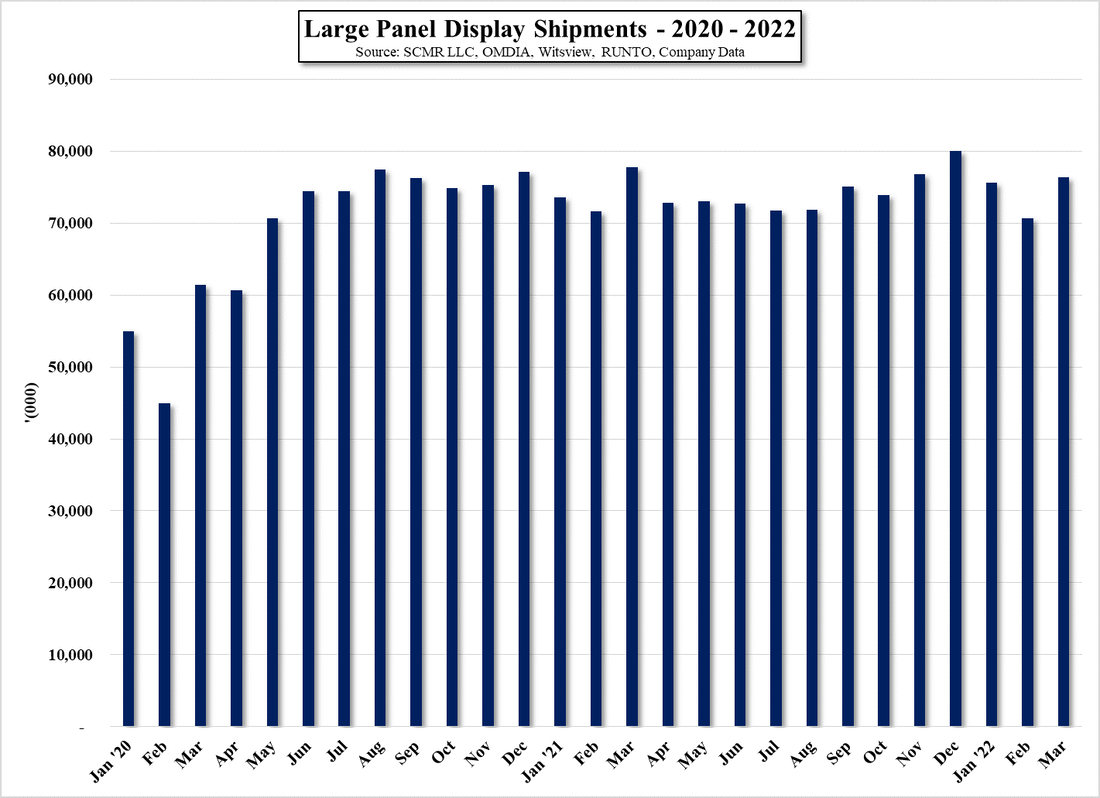
Based on the dire headlines in the display trade press, focused on massive utilization cuts at LCD panel producers, we were expecting very depressing results from producers in August.  “Lowest utilization levels in history”, and similar stories set the tone for disastrous shipment numbers for panel producers in August and we played along mentally preparing for the worst.  As it turns out both from a sales standpoint and a shipment standpoint, August was not nearly as catastrophic as we thought, with large panel combined shipments declining only 1.3% m/m although down 18.1% y/y.  August large panel LCD sales declined 5.7%, while prices dropped 5.2% for the month, which indicates that the impact of the shipment decline was partially offset by an improvement in mix ASP.
The shipment breakdown in terms of application was even more antithetical to industry chatter, with TV shipments up 7.6% m/m and now up 7.1% y/y, the only major panel category that is above last year’s shipment levels.  While the peak and subsequent decline in TV panel prices happened earlier than the cycle with IT panels (monitors, notebooks, and tablets), much of the recent industry chatter concerning utilization cuts was focused on Gen 8 fabs, the mainstay for the production of TV panels, and while IT panels can also be produced on Gen 8 lines, the focus on utilization cuts at Gen 8 fabs would have tilted TV shipments more toward lower shipment levels.
Notebook shipments declined 10.1% m/m and 41.9% y/y and as monitor panel shipments did not peak until December of last year, the y/y comparisons will likely remain weak and while monitor shipments are certainly below any month in 2021 they are still above the lows of 2020 when the pandemic began.  Monitor shipments declined 8.4% m/m and declined 25.3% y/y in August, while tablet shipments increased by 2.5% m/m and declined 3.1% y/y, seeming to hold shipment levels relatively consistent this year.  On a regional basis, while South Korean producers saw the biggest shipment decline m/m in August in terms of revenue (-8.2%), it is hard to disaggregate both Samsung Display’s (pvt) and LG Display’s (LPL) large panel capacity reduction plans from the effect of utilization cuts.  Taiwan saw a 6.7% reduction in panel revenue, a bit more in line with the industry m/m revenue decline of 5.7%, while Chinese producers, where much of the utilization attention has been focused, saw a 4.0% revenue reduction m/m.  On a y/y basis Taiwan was down 55.9%, Korea down 9.8%, Japan down 22.1% and China down37.6% against the combined industry sales being down 37.0%.  For reference, the only panel producer that had a positive m/m sales ROC was HKC (+13.1%), although still down 11.4% y/y.  Samsung Display also had a positive August sales ROC but it is likely only from large panel lines that are in the wind-down process and represents only 0.19% of industry large panel LCD sales.
IT panel shipments did decline in August, some of which we attribute to utilization cuts, but we are even more suspect about the extent of the utilization cuts made at panel producers in August than we were before, given the better shipment results for TV panels.  We expect that much of the doom and gloom came from panel producers themselves who embellished the utilization cuts a bit to create an atmosphere where panel buyers might be concerned that they would be unable to secure even the reduced quotas they would need for August and September.  While this sounds quite cynical, it would not be the first time such a strategy was employed.  If our cynicism proves correct in September it leads us to see a longer cyclical downturn for the industry than if panel producers really made the very deep cuts across all company fabs that were hinted last month.  Hopefully that is not the case as we had anticipated that panel producers would really bite the bullet in August to tighten the overall LCD large panel market, but it looks like that was not the case.
 
Picture
Large Panel LCD Display Shipments - 2020 - 2022 YTD - Source SCMR LLC, OMDIA, Witsview, RUNTO, Company Data:
Picture
TV Panel Shipments - 2019 - 2022 YTD - Source: SCMR LLC, IHS, Witsview, Company Data
Picture
Notebook Panel Shipments - 2019 - 2022 YTD - Source: SCMR LLC, IHS, Witsview, Company Data
Picture
Monitor Panel Shipments - 2019 - 2022 YTD- Source: SCMR LLC, IHS, Witsview, Company Data
Picture
Tablet Panel Shipments - 2019 - 2022 YTD - Source: SCMR LLC, IHS, Witsview, Company Data
0 Comments

Fun With Data – Web 3.0

9/23/2022

0 Comments


Fun With Data – Web 3.0
​

​If you don’t know what Web 3.0 is, you should not feel left out, as the term has a variety of meanings, depending on who you ask, although the basic premise is a system based on blockchain, a decentralized form of data storage that breaks data into ‘blocks’ containing a ‘header’ that identifies the block, the data itself, and a number of ‘identifiers’ that includes descriptive information about the parameters of the block, including some that are used to validate the block before it is processed and others that describe the data.  The blocks, when verified, are added sequentially to the blockchain network, with the links to the previous block creating a chain that cannot be broken, which, in theory, makes the data (transactions, etc.) unalterable. 
After a block is validated it is added to the network, which means every computer on the network has a record of the block and the particular characteristics of the data, whether it is a transaction or or other data.  Only certain nodes do the actual pre-add validation process, but the key to blockchain is the data is ‘copied’ (not actually copied but ‘known to’ all of the computers on the blockchain network, which means if someone tries to change a block on a particular computer, other computers will recognize that the ‘identifiers’ (hash) has changed, as the link to all subsequent blocks will change and the blocks will fail the ‘challenges’ (basically a check to see if the hash is correct) and the data will be ‘unconfirmed’. 
Depending on the network, the number of confirmations needed varies, but without the required number of confirmations the data is not valid, so the more confirmations blocks have the more ‘secure’ the data is considered.  Given the complexity of the algorithms[1] used to confirm a block, confirmation time can vary and this is where ‘miners’ come in.  As transactions are uploaded to the network they enter a ‘pool’ before they are added to the blockchain.  Miners can select these unprocessed transactions, on which they run the complex validation algorithms to confirm the transaction blocks at which point they are added to the blockchain.  Since the mining process is expensive in that it requires high-speed processing which consumes considerable power, each transaction in the pool carries a transaction fee determined by the originator of the transaction.  Miners will take those transactions with the highest fees from the pool first, which means that those transactions that offer lower fees to miners will take longer to get added to the blockchain.
In Bitcoin, mining a block takes about 10 minutes (equal to one ‘confirmation’) so it can take considerable time for those transactions that want more security than the typical three confirmations needed for bitcoin transactions.  In order to speed up the process other networks like Ethereum use a system called POS (Proof of Stake) as opposed to the POW (Proof of Work) system described above, which is a simpler system that allocates block publishing through a lottery using the amount of each ‘stakers’ (equivalent of ‘miner’) holdings across the network.  The POS system reduces the hardware and energy requirements needed to publish blocks to the blockchain network, although it is said to give large stakers more control over the network as the more funds a staker has on the network, the more chance they will be picked to post the next block.
So what does this have to do with our fondness for data?  Web 3.0’s decentralized approach to the internet, as opposed to Web 1.0 (static content) and Web 2.0 (user-generated content), Web 3.0 gives the promise of increased transparency and the security that transparency should provide, and consequently move power away from some of the companies that exert significant control over the internet (Facebook (FB), Amazon (AMZN), etc.).  Of course, this is still up for debate, and our suspicious/cynical nature leaves no doubt that such an idealistic goal will find was in which to be corrupted by ‘other’ power/money hungry companies/institutions as Web 3.0 develops, but in the interim, there seem to be plenty of investors willing to pump billions into private companies that they believe will be the ones that will benefit from Web 3.0.
VCs pumped ~$4.3b and $4.9 into Web 3.0 companies in 2019 and 2020, but really caught the bug in 2021, where that spending increased by 571.5% y/y to almost $33b, and while 2022 has seen a considerable slowdown in VC funding activity, based on the spending in the 1st half of this year and the seasonality of 1H/2H Web 3.0 VC investments, one might assume that  the 2022 estimate derived from 1H VC spend for Web 3.0 this year, would only decline by ~3.1% to $31.78b, as shown in Figure 1.  That said, the detail shown in Figure 2 gives a different outlook on VC Web 3.0 spending for the year given that 3Q spending fell by 89.1% q/q/ and 89.9% y/y to $0.72b, and while we would hesitate to make a stab at a realistic 4Q estimate given the almost inconceivable volatility this year, we would guess that given the current macro environment, it would lead to a lower 2022 spend than the statistical estimate in Figure 1 shows.
Perhaps funding to VCs with a penchant for Web 3.0 investments has slowed and private valuations are reflecting a bit of the lower valuations the market is placing on public companies, however investor optimism on a long-term basis, despite the weak 3Q, seems to have remained high, so as long as VCs are able to exit investments profitably over the remaining few months of this year and the 1st half of next, we expect funding will improve a bit from 3Q’s $0.72b, but while crypto companies are still a relatively small part of overall VC Web 3.0 investments, the rather poor performance of crypto this year casts a negative light on the space to some degree.  Blockchain is certainly a valid data storage and valid technology, especially for financial transactions but the massive spike in early stage investments seen last year and earlier this year might moderate a bit as VCs become a bit more selective toward potential investments.


[1] SHA-256 – A cryptographic function that always produces the same output (hash) for a given input.  There is no known way to figure out what the input should be to get a specific output, so miners must try millions of input combinations before they can match a block’s hash identifier which is 256 bits.
Picture
Yearly VC Spending on Web 3.0 - Source: SCMR LLC, Crungchbase.com
Picture
Quarterly VC Spending on Web 3.0 - Source: SCMR LLC, Crunchbase.com
0 Comments

Alternatives - Part I

9/22/2022

0 Comments


Alternatives - Part I
​

​As the display industry matures, display production becomes increasingly application specific, with broad segment headers like ‘TV’ or ‘IT’ becoming anachronistic, and sub-categories becoming the only way panel producers can differentiate themselves from each other.  There are many ‘large panel’ and ‘small panel’ display producers, but even if you are a leader in a particular panel application, the competition can be quite intense and the inherent cyclicality of the industry, devastating to profitability.  As that cyclicality peaks, as it did in July of last year, panel producers try to narrow their focus on those applications or processes that carry the highest premiums.  While this is a viable strategy in the near-term, LCD fabs are not always designed or equipped to make those changes, which means capital cost and becoming part of a queue for equipment delivery.  In some cases, by the time the equipment is delivered and the production changes are made, that particular application niche becomes crowed with other producers and premiums disappear, which belies the strategy’s positive effect on profitability.
The alternative is to approach the panel business as one that anticipates rather than follows the application trends, and while this is a seemingly obvious path, it presents its own challenges and risks.  First, the research involved in advancing display technology usually starts on a small scale, typically a lab project that takes an idea and produces a small scale ‘proof of concept’ device or process that either solves existing display technology limitations, or makes a step toward a new basic display technology or ‘flavor’ of an existing one.  This is a tricky stage as the researchers will likely aggressively promote the merits of the idea, citing a variety of reasons why and how it can scale to a mass production level, while process engineers must build a model that can quantify the cost, potential scale problems, and the availability of the equipment necessary to build out such capacity, with product marketing trying to figure out whether there is or will be a market for the application best served by the technology and whether it is sustainable enough to justify the cost.
If a project makes it through the POC stage, it will typically move to the construction of a pilot line, a small line that gives process engineers a taste of how the scale model will transfer to production on a physical basis.  Such lines are variable in that they usually undergo modifications as process bottlenecks and problems occur, with panel producers working with equipment vendors as to the feasibility, cost, and timelines needed to bring up a full mass production line.  If the display process seems practical, a few samples will be made on the pilot line to be shown to key customers to see if they spark enough interest to validate the expansion to mass production.
To this point, the cost of the project is typically buried in R&D expenses, however if the project seems practical and there is customer interest, C-level decision acceptance of moving the model to mass production status begins a far more substantial capital budget process.  Given that the cost of even a small mass production display line can cost hundreds of millions to billions, the risks involved in such a decision can exceed the resources of many panel producers or stress the level of profitability across the entire company.  What makes this even more difficult currently is that there are a number of emerging display technologies that are vying for capital, all hoping to become the basis for the display supply chain over the next few years, which increases the risk of picking the wrong technology or application even higher than in past years for smaller panel producers, and spreading R&D too thin for larger panel producers.
LCD technology has been the basis for the display industry for many years and advances in LCD process technology continue to be made however as that technology has matured it becomes more difficult for those advances to be substantial , which forces LCD panel producers to look for premiums by finding niche products where competition is less onerous.  Years ago LTPS (Low temperature Poly-Silicon) was the TFT backplane process that was touted as the replacement for a-Si (Amorphous Silicon) that had been used since LCD production began, and many panel producers converted TFT lines to the new technology to capitalize on its benefits, especially in small panel production.  This transition took years for many panel producers, so those who anticipated the transition were able to capitalize on the premiums afforded the new technology.
In 2012 Sharp (6753.JP) began production of a new TFT backplane technology based on IGZO (Indium Gallium Zinc Oxide) that promised to improve LCD backplane technology once again, and while this technology was more difficult to master from a process standpoint, larger panel producers began to adopt IGZO for specific panel applications, while small producers were still working toward LTPS adoption.  In 2014 Apple (AAPL) commissioned the use of another TFT backplane technology in the Apple Watch Series 4, and while this technology, which is a combination of LTPD and IGZO, is to be Apple’s ‘goto’ mobile display technology, there are only a few panel producers able to produce the technology, with Samsung Display (pvt) the only current commercial provider for smartphones and similar devices. 
While Apple will likely have 2 or 3 LTPO suppliers in 2023, smaller panel producers will be years behind, with many still working toward adopting IGZO, with the timeline between each iteration of this one aspect of LCD technology becoming shorter.  Without the most current backplane technology smaller producers will find it difficult to gain access to major CE brands and will be forced to focus on more generic panel technologies, which are far more cyclical.  As noted this is just one aspect of display technology and one that is rarely in the public eye, so early development cycles were able to be long as demand from consumers was relatively minor, but as ‘front of display’ technologies, such as OLED, began to gain public traction, the time-to-market for each new display technology ‘leap’ became compressed.
In Part II of “Alternatives” we look at some of the more recent display technologies that are vying for R&D and capacity expansion dollars and how smaller panel producers are being forced to adopt the ‘niche-or-die’ strategy mentioned above.  Stay tuned.
 
0 Comments

Fun With Data – Smartphone Residual Value

9/22/2022

0 Comments


Fun With Data – Smartphone Residual Value
​

Smartphones are like cars, they depreciate rapidly as soon as you take them out of the box.  Most carriers and smartphone brands offer trade-in options to encourage users to upgrade or replace their phones with the ‘newest’ models with those values based on complex formulae for each brand and model. There are alternatives to carrier or brand trade-in values, with aggregators showing the best prices available for used phones, which can be shipped to the purchasing company for free (They even give you a printable shipping label), with payment via PayPal (EBAY) within 2 days of the receipt of the phone.  Most deals have a 14 day lock-in on the quoted price, with the only mitigating factor being the condition of the phone, as most give quotes for mint or good condition levels and quotes for those with cracked screens are considerably lower.
 What was most interesting is the data we put together for a number of Samsung (005930.KS) Galaxy phones gives some understanding of how smartphones depreciate.  The most recent additions to the Galaxy line, the Z Flip 4 and Z Fold 4 have depreciated 60.0% and 59.4% in the ~1.7 months since their release, given credence to the “…as soon as you open the box…” theory, and while last year’s Z Flip 3 and Fold 3 models have continued to depreciate 12 months after their release, they have only seen a total depreciation increase of 12% and 10% over the initial drop.  Taking those models back even further, the Z Fold 2, released in September of 2020 saw only a 6.5% increase in depreciation over the newer model during its second year of life.
The Galaxy S flagship series fared a bit better, with the newest models, the S22 Ultra, S22+, and S22 depreciating only 46.6%, 54.7%, and 57.9% respectively since their release in February of this year.  Samsung’s mid-priced line, the “A” series, priced between $600 and $250, did not fare well, with the most recent model, the A53, released in March, depreciating by 87.3% of its initial value in only 7 months, for a rate of 13% price depreciation/ month.  Even Samsung’s lowest price tier models, the “A0s” series, which sell for between $250 and $105, saw slower depreciation rates, although most have little or no residual value.
The table below shows a variety of Samsung Galaxy models, their initial price when released, the best current offer for ‘mint or good condition’ phones, the release date, monthly depreciation rate, and the total depreciation, using the first day of the release month for calculations. Figure 1 shows the monthly rate of depreciation from release date to today across those models in the list.  While it does not represent the total Samsung line, it gives a better understanding of the monthly rate of value depreciation as the phones age.
Note: I personally have two smartphones, a relatively new (8/21) which cost $499 and a very old (4/14) S5, which cost $649.  While the S5 is over 8 years old, it’s the phone I use the most because of its size, which is ~14% smaller than the newer model and doesn’t stretch out pockets.  The monthly depreciation rate on the S5 is 1%/month, although it has no residual value 
​
Picture
Picture
Picture
Samsung Smartphone Depreciation - Monthly - Source: SCMR LLC
0 Comments

Apple Makes It Easier to Fix an iPhone, Mostly

9/20/2022

0 Comments


Apple Makes It Easier to Fix an iPhone, Mostly
​

​In the past Apple (AAPL) has been criticized for its policies concerning the repair of its products, particularly iPhones, which had to be returned to the company or brought to an authorized Apple service center at considerable expense.  Opening an iPhone as a user would invalidate the warranty and cause even more expense for repairs.  Apple did not supply components for repair to non-Apple repair centers and used a number of screws and other connectors that were not typically available, making it quite difficult for sources outside of the Apple world to make such repairs.  Apple’s theory behind these rules was to guarantee that all repairs were done with quality replacement parts (supplied by Apple) and that the quality of the work met with Apple’s rigorous standards, and to a degree that was true, but the underlying factor of channeling all repair work to Apple-related entities to capture incremental revenue, was hard to ignore.
Last year Apple agreed to loosen it’s strangle hold on the repair of Apple products, as we mentioned in our 04/28/22 note which indicated the availability of Apple repair manuals, tool kits, and parts, allowing almost anyone willing to pry open their iPhone, a shot at fixing a dead battery, replacing the cracked screen or other more complex repairs if their warranty has expired and it seems that Apple really took the idea to heart with the iPhone 14 family, which has been completely redesigned to be ‘repair friendly’, although that only applies to the iPhone 14 Pro and iPhone 14 Pro Max, the upper-end of the iPhone 14 line. 
Recent teardowns of the new iPhone 14 family have revealed that Apple completely redesigned the interior of the iPhone 14 Pro and Pro Max, making them almost modular in that the two high-end models can be opened from the back of the device (last one that had that option was the iPhone 4s, released in October 2011), rather than prying open the device from the front.  The display and glass panel (rear) are held by only two screws and two connectors and are not glued  to the frame or other panels or held by a number of oddly shaped screws, some of which have been hidden, causing the necessity of removing other components.
iPhone 14 repair documents indicate that the iPhone Pro and Pro Max are essentially 3 layer ‘sandwiches’ consisting of the display, a mid-frame that contains most of the internal components, and the rear glass panel.  This means that the cost of repairing a cracked rear glass cover becomes far less expensive, and screen replacement should similarly be less costly.  Whether Apple passes that savings on to customers remains unknown as the company likely received considerable grief from its authorized repair members who no longer have the exclusive rights to repair Apple devices.  That said, the internal changes do not extend to the iPhone 14 and iPhone 14+.
While perhaps not as altruistic as it might seem on the surface, we certainly give Apple credit for making these changes and following through on its promise to make repairs easier and more accessible.  Hopefully they follow through further next year with a similar redesign of the interior of the lesser priced iPhone models, but progress is progress and is worth commendation.
What the Matter with Matter?
We have written about the upcoming “Matter” connectivity standard a number of times over the last few years as it has the ability to be a unifying force between brands that will jump start the on-again/off-again smart home industry, which is in dire need of a reason for existence, other than to add to the human desire to become part of the living room couch for the bulk of the day.
The Matter platform, which is supported by literally hundreds of CE and associated companies, from Amazon (AMZN), Google (GOOG) and Samsung (005930.KS), to Ikea (pvt), Vodaphone (VOD), and Shenzhen SEI Robotics (pvt), will allow all devices that are certified by the Matter organization to interoperate.  In theory this would allow smart home devices, most of which operate on proprietary networks and protocols, to essentially control each other, giving consumers the ability to cherry pick products that fit their requirements, rather than have to stay with a particular brand for all.
We say ‘in theory’ because the Matter standards were due out last year, and again at CES early this year, but to data have not been launched.  Not surprisingly, there are rumors of infighting between members and factions over where the standards will go in the future, and despite the fact that lead members Amazon and Google have pledged to upgrade products to the Matter standard many companies are still promoting their own proprietary smart home platforms. 
The Matter undertaking is a large one, with hundreds of product types, models, and flavors in the smart home market, few of which are compatible. Which forces consumers to have a proprietary system for dimming the lights and another for programming the washer/dryer, which along with the increased R&D a system development cost, is the primary reason why the smart home business has not taken off, especially during the COVID pandemic. 
In fact it seems that the delays involving Matter have put such pressure on some smart home brands that a company like Lenovo (992.HK), a well-known laptop brand, seems to have decided to shut down its smart home products business.  Lenovo’s smart home products are smart plugs, smart power strips, smart clocks, and smart LED lightbulbs, along with a number of 3rd party products, which it has been promoting since 2017, but word from retailers is that the company is moving out of smart home products given the lack of traction in the space.
There are certainly a portion of the global population that could find significant value in smart home devices, as the simple tasks that smart home devices can accomplish are not easy for the disabled, but this is a relatively small market that is only attractive to niche brands.  For the industry to see real momentum it must be easy for consumers to use.  No separate controls for each device, no hubs for each system, and no high prices, all of which could become a reality if Matter or a similar unifying protocol becomes the way of the world.  But human nature seems to have taken hold in the CE space once again and put proprietary interests above those of the target audience, leaving those without strong financial support and R&D financing to slowly walk away from the space.  This is not the first time bickering between parties has stymied the smart home business, but the early momentum behind Matter was so strong that it seemed to be a possible solution for the smart home industry.  Now we just have to wait and see if the standard will actually be released before the current generation of potential smart home customers gives up.
0 Comments

Spreading the Wealth – LG Invests in QDs

9/20/2022

0 Comments


Spreading the Wealth – LG Invests in QDs
​

LG Electronics (066570.KS) (technically LG Group) owns LG Technology Ventures, the company’s VC arm.  With ~40 investments and $400m in fund assets, the portfolio of early-stage start-ups are chosen in order that they might develop strategic partnerships with other LG companies in a number of strategic areas including advanced materials.  Most recently LGTV made a $2.155m investment in InnoQD (pvt), along with additional investments by Wonik IPS (240810.KS), a well-known Korean supplier of display and semiconductor tools, and local VCs for a total of $4.31m, with an additional ~$1m in progress.  The company had previously raised ~$4m in earlier financings.
InnoQD is a developer and producer of QD materials that specializes in resin development, a material that is mixed with quantum dots it both protects the QD material from exposure to air and water along with barrier films, and holds the quantum dots in place.  One issue that faces quantum dot films is the dispersion of the quantum dots across the display film.  Poorly distributed QDs cause color and light changes where QDs are bunched or thinly dispersed.  By maintaining a highly uniform concentration of QDs across the film, the film can be thinner and have more consistent results across its entire area and by starting the protection of the QDs at the resin level, thinner barrier layers can be used and lifetime extended
InnoQD has purchased a factory and has production equipment on order, with expectations for mass production next year in collaboration with LG Display (LPL) and Nanosys (pvt) as the supplier of the basic QD material.  While LG Display has a strong focus on OLED, parent LG Electronics is broader based with a line of Mini-LED/QD and QD only TVs based on Nanosys QD material.  The investment in InnoQD will hopefully reduce the cost and increase the quality of LG’s QD products and potentially create a path toward the two goals in the quantum dot timeline, full ink-jet QD printing (Samsung Display’s (pvt) QD/OLED is using it) and self-emissive quantum dot displays in the future.
Picture
Typical QD Enhancement Film - Source:InnoQD
Picture
Scanning Electron Microscope Image of quantum dot clusters - Source: InnoQD
Picture
Highly Ordered Quantum Dot Clusters in a Polymer Matrix with arranged holes - Source: Oxford Instruments
0 Comments
<<Previous
Forward>>

    Author

    We publish daily notes to clients.  We archive selected notes here, please contact us at: ​[email protected] for detail or subscription information.

    Archives

    May 2025
    April 2025
    March 2025
    February 2025
    January 2025
    January 2024
    November 2023
    October 2023
    September 2023
    August 2023
    June 2023
    May 2023
    February 2023
    January 2023
    December 2022
    November 2022
    October 2022
    September 2022
    August 2022
    July 2022
    June 2022
    May 2022
    April 2022
    March 2022
    February 2022
    January 2022
    December 2021
    November 2021
    October 2021
    September 2021
    August 2021
    July 2021
    June 2021
    May 2021
    April 2021
    March 2021
    February 2021
    January 2021
    December 2020
    October 2020
    July 2020
    May 2020
    November 2019
    April 2019
    January 2019
    January 2018
    August 2017
    July 2017
    June 2017
    May 2017
    April 2017
    March 2017
    February 2017
    January 2017
    November 2016
    October 2016
    September 2016

    Categories

    All
    5G
    8K
    Aapl
    AI
    AMZN
    AR
    ASML
    Audio
    AUO
    Autonomous Engineering
    Bixby
    Boe
    China Consumer Electronics
    China - Consumer Electronics
    Chinastar
    Chromebooks
    Components
    Connected Home
    Consumer Electronics General
    Consumer Electronics - General
    Corning
    COVID
    Crypto
    Deepfake
    Deepseek
    Display Panels
    DLB
    E-Ink
    E Paper
    E-paper
    Facebook
    Facial Recognition
    Foldables
    Foxconn
    Free Space Optical Communication
    Global Foundries
    GOOG
    Hacking
    Hannstar
    Headphones
    Hisense
    HKC
    Huawei
    Idemitsu Kosan
    Igzo
    Ink Jet Printing
    Innolux
    Japan Display
    JOLED
    LEDs
    Lg Display
    Lg Electronics
    LG Innotek
    LIDAR
    Matter
    Mediatek
    Meta
    Metaverse
    Micro LED
    Micro-LED
    Micro-OLED
    Mini LED
    Misc.
    MmWave
    Monitors
    Nanosys
    NFT
    Notebooks
    Oled
    OpenAI
    QCOM
    QD/OLED
    Quantum Dots
    RFID
    Robotics
    Royole
    Samsung
    Samsung Display
    Samsung Electronics
    Sanan
    Semiconductors
    Sensors
    Sharp
    Shipping
    Smartphones
    Smart Stuff
    SNE
    Software
    Tariffs
    TCL
    Thaad
    Tianma
    TikTok
    TSM
    TV
    Universal Display
    Visionox
    VR
    Wearables
    Xiaomi

    RSS Feed

Site powered by Weebly. Managed by Bluehost