Supply Chain Market Research - SCMR LLC
  • Blog
  • Home
  • About us
  • Contact

LG Ends LCD TV Panel Production in Korea

12/12/2022

0 Comments


LG Ends LCD TV Panel Production in Korea
​

​LG Display (LPL) has decided to end TV panel production in South Korea by winding down production at its P7 LCD fab , producing only to fulfill long-term existing contracts.  LGD is also expected to reduce LCD TV panel production at it fabs in Guangzhou, China from 210,000 sheets/month to 120,000 sheets/monthly, leaving that fab as the only one that will continue to produce LCD panels for the TV space. LGD’s P8 fab, which is a Gen 8 fab will produce LCD panels for IT displays (notebook, monitor, and tablets).
LG Display has expressed its intentions to reduce or eliminate LCD TV panel production in South Korea in the past, however the rise of TV panel prices during the COVID-19 pandemic in 2020 and 2021 , gave them reason to postpone those changes, likely with encouragement from parent LG Electronics (066570.KS), who, along with most other TV set manufacturers faced short supply from other sources.  Since last July the price of LCD TV panels has declined precipitously, making the decision a bit of an assumption.
Both Samsung Display and LG Display have been facing aggressive competition from Chinese panel producers, who are able to produce generic LCD TV panels less expensively due to lower labor costs and government subsidies.  In recent quarters, LG Display, along with other non-Chinese panel producers, have shifted away from direct competition with the Chinese and tried to change their mix toward higher margin more specialized products.  While this has offered a bit of protection from competition, weakness in the overall display market has lessened the benefits of those changes and pushed LGD and potentially others to restructure fabs in order to maintain a profitable mix.
Some have moved toward OLED, which we expect will be the case for LG Display in the future, converting P7 to either an OLED IT panel fab or an OLED TV panel fab, but given the current macro circumstances, such decisions can wait for a quarter or so to see how the holidays pan out and what the longer-term picture might be.  While it is expensive to have an idle fab of the size of P7, it is certainly less expensive than running it at low utilization rates or producing at cash costs or below, so the decision was imminent, although we will have to wait until January to get more information on how quickly the implementation will take place, the cost, and if any plans for the future of the fab have been made.
0 Comments

November Taiwan Panel Data – “Hangover Year”

12/9/2022

0 Comments


November Taiwan Panel Data – “Hangover Year”
​

​As we have noted in the past, public companies that are listed on the Taiwan exchange are required to report sales on a monthly basis.  This gives investors a view of actual results during the quarter, rather than having to wait for quarterly results, and helps us to spot trends that are company specific or industry wide.  There are three display producers in Taiwan, AU Optronics (2409.TT), Innolux (3481.TT) and Hannstar Display (6116.TT), although Hannstar is primarily a small panel display producer.  We have been tracking such data since 2003 and have built our models using such monthly results, along with a number of other data sources, to gain insight into the display space as a subset of consumer electronics.  It is our wish that other exchanges would implement the same monthly requirements, but realistically the likelihood is infinitesimal so we take what we can get.
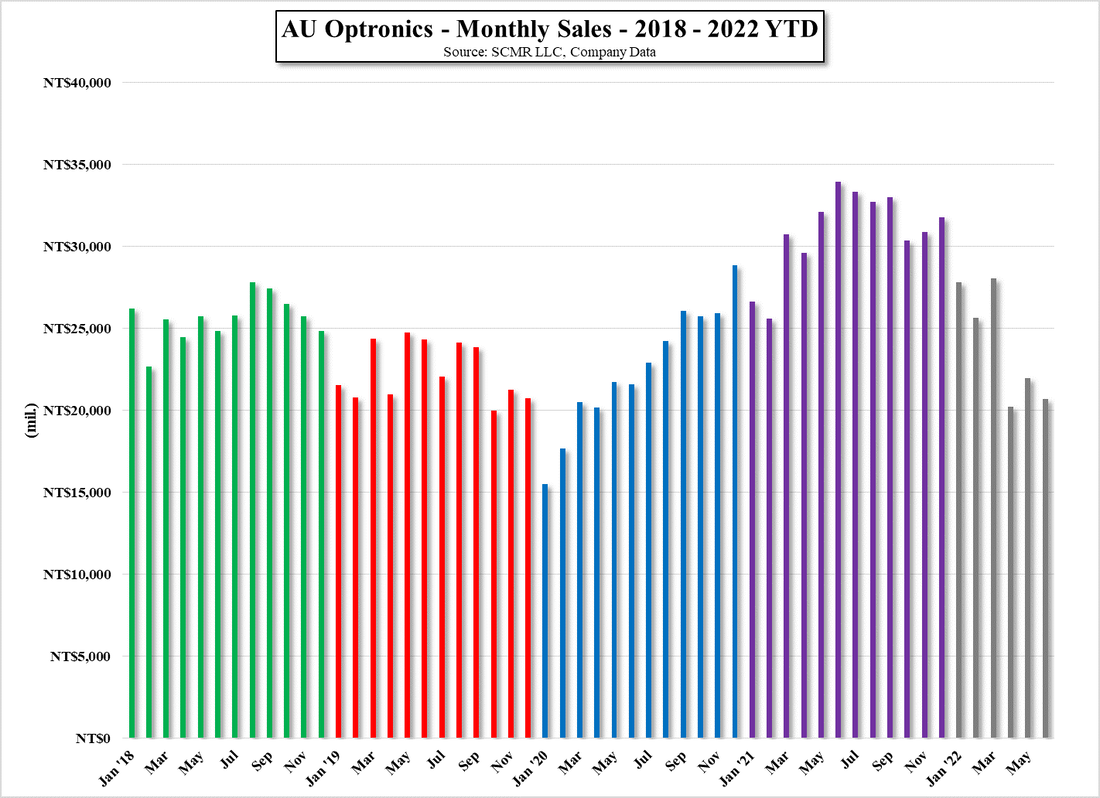
AU Optronics reported November sales of NT$17.48b ($571.04m US), up 1/7% m/m and down 43.4% y/y, as a typical (5 yr. avg.) November has been up 1.2%, November m/m results are slightly better than average.  AU Optronics reported area shipments of 1.5m m2, up 17.3% m/m but down 30.2% y/y, which implies an ASP/m2 of NT$11,650, which is down 13.1% m/m and down 18.9% y/y.  Based on the November report, AUO saw improved utilization but lower panel prices, netting out to a slight improvement in overall sales.  December for AUO is typically up 0.4% m/m.
Innolux reported November panel sales of NT$16.182b ($528.63m US), up 3.7% m/m and down 39.1% y/y.  With a typical (5 yr. avg.) November being down 3.8%, Innolux saw a stronger than expected improvement in sales during the month.  Innolux also reported large panel shipments of 9.17m units, up 4.6% m/m but down 22.8% y/y, and 19.75m small panel units, down 9.9% m/m and down 29.3% y/y.  December is typically up 1.5% m/m for Innolux.
November panel sales for both AUO and Innolux were better than we expected given the relatively poor results we have seen from CE retailers, albeit mostly anecdotal, bringing the 4th quarter YTD (2 months) results up 3.6% q/q for AUO and up 2.4% q/q for Innolux, but if we assume a flat December for AUO, 2022 will show the worst yearly performance since 2005 which puts the year in better perspective. Results from other panel producers will likely be less onerous using the same long-term perspective, particularly Chinese LCD panel producers, as they have ben adding capacity over the last few years while Taiwan producers have not, but we expect that on a static capacity basis most panel producers’ full year results would look the same.  We look at 2022 in the LCD panel business as the ‘hangover year’, after the parties in 2020 and 2021, and expect 2023 to be a bit less frenetic but still needing Tylenol™ and electrolytes to make it through the year.
Picture
Picture
AU Optronics - Monthly Sales - 2018 - 2022 YTD - Source: SCMR LLC, Company Data
Picture
AU Optronics - Shipment Area and Sales/m2 - Source: SCMR LLC
Picture
Innolux - Monthly Sales - 2018 - 2022 YTD - Source: SCMR LLC, Company Data
0 Comments

A Touchy Situation

12/2/2022

0 Comments


A Touchy Situation
​

Many consumer electronics companies have developed or purchased dedicated production facilities for key components, who can both guarantee supply and use excess capacity to produce for external brands, especially display panels that are the basis for many CE products.  Typical examples would be Samsung Electronics (005930.KS) affiliate Samsung Display (pvt), LG Electronics’ (066570.KS) subsidiary LG Display (LPL), China’s TCL (000100.CH), that owns Chinastar (pvt) and Foxconn’s (2354.TT) ownership of Innolux (3481.TT).  These panel producing subsidiaries run quasi-independently in most cases, and while they are typically the primary display supplier to the parent company, they are not necessarily the only supplier, with parent TV, IT, and mobile divisions purchasing displays from a variety of sources, with many of those decisions based on supplier panel pricing and expertise.  Further, most large CE brands farm out design and assembly of a portion of their lines to OEM/ODMs, who are not necessarily bound to the brand’s supplier list, allowing them to source display panels from suppliers with whom they have relationships.
 
This leads to an ever-changing complex web of interconnections that not only can influence company results but play a significant part in ‘display’ politics, and recently a conflict between LG Electronics and Chinese panel supplier BOE (200725.CH) has made those connections and conflicts quite obvious, and exposes the struggle that such purchaser/supplier relationships can incite. 
 
BOE is the largest LCD panel producer in China and the largest producer of LCD panels globally.  While the company has been growing both capacity and sales over the last few years, BOE faces stiff competition from both Samsung Display and LG Display as BOE tends to be the less expensive supplier.  That said, BOE has been so aggressive toward building its large panel LCD display business that it became apparent to both competitors that they could not compete with BOE on a price basis, which led to SDC’s complete withdrawal from the large panel LCD production market, and LGD’s large reduction in large panel LCD capacity. 
 
Both competitors however have developed OLED capacity as they have decreased LCD capacity, with SDC dominating the small panel OLED market and LGD dominating the large panel OLED market and remain closely tied to parent organizations due to those display products.  BOE, while putting billions to work toward building out its own OLED capacity, does not have the OLED experience that its South Korean competitors have, and has faced challenges as it has entered the OLED display market.  One of the bellwethers for the OLED market is being added to Apple’s (AAPL) display supplier list given Apple’s stringent requirements for its displays, and as BOE has been qualified as an Apple OLED supplier, after an arduous and frustrating path to that goal, BOE has shown itself to continue to be a strong competitor.
 
In fact, due to BOE’s large scale LCD production capacity, the company supplies displays to both Samsung Electronics and LG Electronics, and is the largest outside display supplier to LGE, supplying over 40% of their large panel LCD displays, which would make one assume that they have a somewhat ‘protected’ status with the parent organizations, but that is not the case.  Samsung Electronics recently omitted BOE from its supplier list, likely over a conflict between the companies over an advertising fee that Samsung required from BOE,, and Samsung Display has issued a warning to BOE and its customers over allegations that the company tweaked its pixel structure slightly to avoid paying SDC a license fee for the underlying IP.  Included in that warning to BOE’s customers was Apple, SDC’s largest outside customer which makes the conflict all the more sensitive to SDC where a misstep could damage that key relationship (Samsung Display is expected to have captured between 70% and 80% of the display business for the Apple iPhone 14).
 
If that is not enough of a conflict, a subsidiary of LG Display known as Global OLED Technology LLC (pvt)[1], that maintains and licenses the OLED IP that is owned by LG Group (pvt), the entity that controls all LG companies, has also recently warned BOE that it is infringing on OLED patents owned by LGD.  However, thus far they have limited the conflict to just a warning and have yet to file any court documents, the typical next step toward forcing BOE to pay due royalties.  Given the large role that BOE plays in the TV business of LG Electronics, there are multiple factions involved in the pursuit of IP license dollars from BOE, bringing such conflicts to the highest levels of corporate hierarchy.
 
Such IP battles have always been a part of the display space and the CE space overall, but we expect to see more aggressive behavior, not only due to the competitive nature of the players, but as a result of the display cycle.  Since 2020 panel producers have been focused on being able to supply COVID related increased demand and with that goal, have paid less attention to costs.  With demand slowing and costs still high profitability has waned, which we believe will focus more attention on cost containment going forward.  Along with costs we expect and increased focus on exploiting existing revenue sources that are not display production oriented, and there is nothing better than a high margin royalty in that regard.  We expect a renewed focus by display IP holders to capture IP dollars in 2023, and while this might rile feathers a bit, we expect to see a bit of a shift in corporate sentiment toward enforcement rather than appeasement as a result.


[1] Global OLED Technology LLC is 32.7% owned by Idemitsu Kosan, a Japanese chemical supplier, with the rest divided between LG Display, LG Chem, and LG Electronics. 
Picture
BOE Large Panel LCD Capacity vs. Large Panel Sales - Source: SCMR LLC, OMDIA, RUNTO, Company Data
0 Comments

Panel Pricing – Reading the Tea Leaves

12/1/2022

0 Comments


Panel Pricing – Reading the Tea Leaves
​

Display panel pricing is a singular piece of incremental data in the CE space.  Given that almost every CE device has a display of some sort, display attachment rates are near 100% and with displays typically the most cost single component of a device, their price is integral to the overall BOM.  While the price of displays does not immediately track to CE device retail prices as display inventory can reside at many points in the CE supply chain, the trend in display panel pricing  can signal both changes to consumer CE prices on a forward basis, and the profitability of a number of participants in the CE supply chain. 
First in line would be the panel producers themselves, a relatively limited number of players that can be categorized by their size and/or their product line-up, but as the supply chain for the display industry itself is a complex one, each sub-group, while they certainly have their own characteristics, is affected by display panel pricing, some of which are industry groups created specifically for the display industry.  Display glass is one such industry, and while a subset of the overall glass industry, there are only a few players that produce commercial quantities of glass for displays.  In a real sense there are only a few major players, Corning (GLW), Asahi Glass (5201.JP), Nippon Electric Glass (5214.JP), Avanstrate (500295.IN), Schott (pvt), and Rainbow (438.HK).  Given that glass is the substrate or working production platform for almost every display, display prices, while not directly affecting display glass prices, can be a harbinger of demand for this particular ~$6b market.
LCD displays are driven by LED backlights, which are a subset of the overall LED manufacturing industry that includes LED lighting as its largest application (~33% in 2021).  but if you add signage, consumer products, large displays, mobile displays, and Mini/Micro-LED displays, display applications are 38% of the LED market (sales), larger than lighting, making display pricing a key function of that ~$16b market.  Display production equipment, another highly specialized industry, is a ~$10b industry that is closely tied to panel demand as reflected in panel pricing, and the causality of display price changes has a great influence on the electronics assembly business, where companies like Foxconn (2354.TT), Wistron (3231.TT), Pegatron (4938.TT) and Quanta (2382.TT), acting as assemblers or as ODM/OEMs, can see their business change radically as display pricing trends change.
Outside of the display supply chain, there is a litany of CE companies who must compete against each other to provide the most value to consumers, who have relatively little loyalty to brands and see CE products as ones that should always come down in price.  Display choices by such brands are significantly affected by display panel prices as a major contributor to product BOM and margins, so there are few in the CE space that are not directly or indirectly influenced by display prices, the reason we have been collecting such data since 2009 and are a bit obsessive about tracking such data.
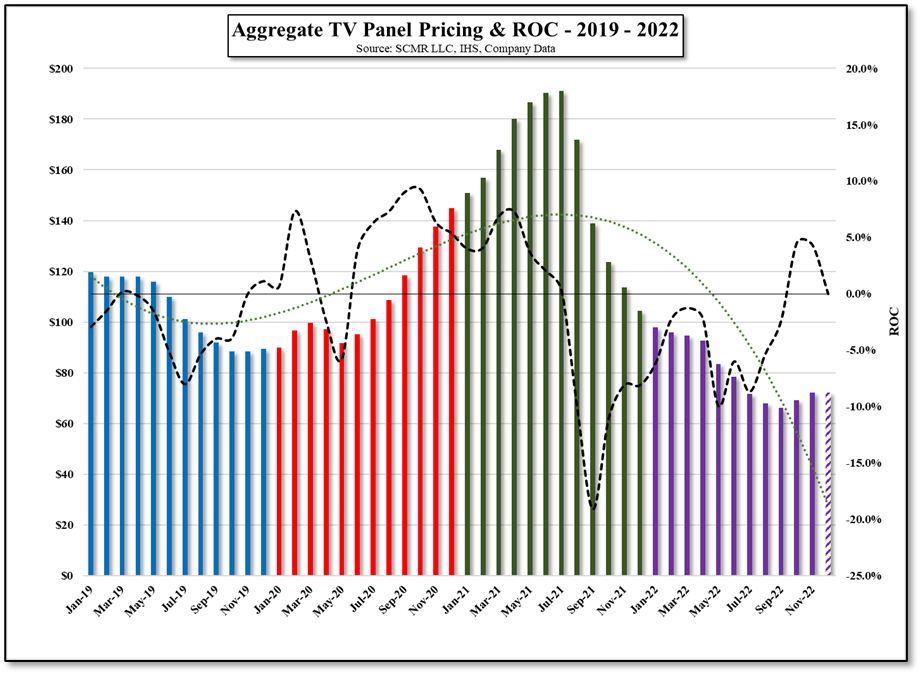
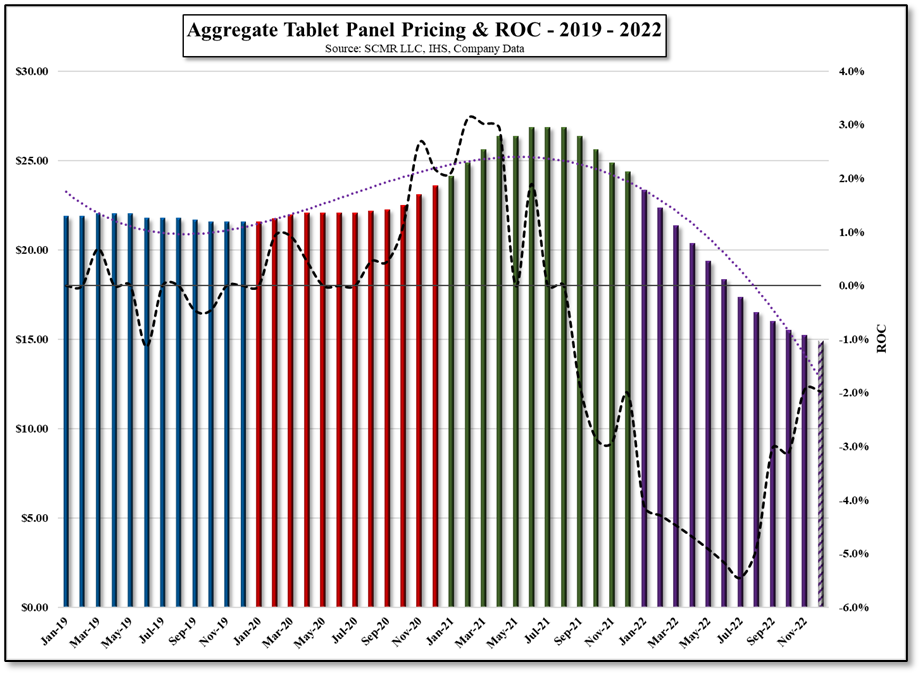
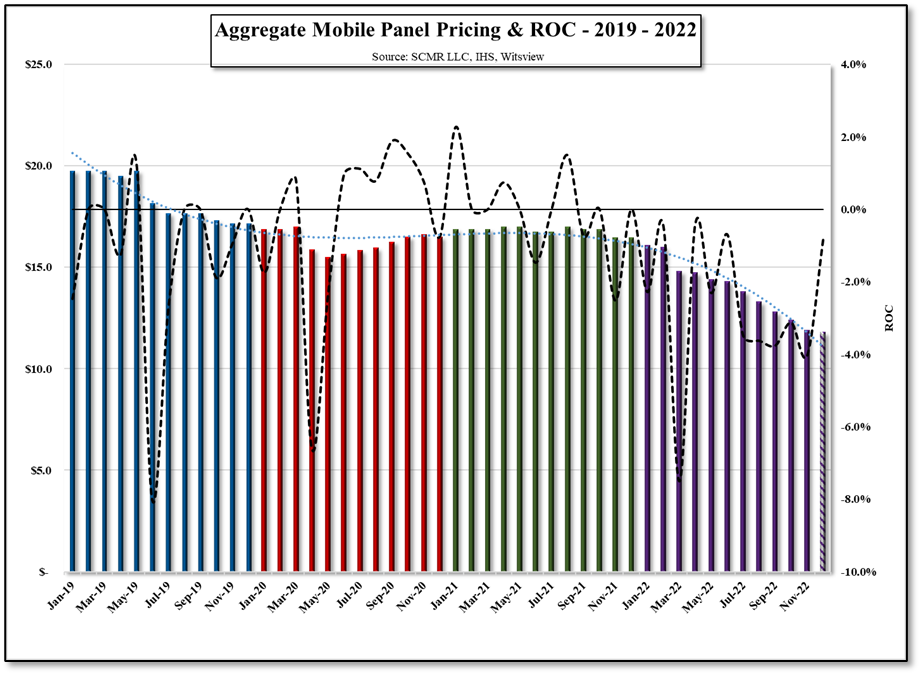
OK, enough self-justification…   November display pricing was positive (m/m) for the first time this year, which many will take as a sign of a pricing recovery, however the overall increase was entirely the result of TV panel prices, which increased by 4.3% in the aggregate, while all other panel categories declined.  TV panel prices, which began their climb during the early days of the COVID pandemic, started falling sharply last July as consumers began to venture from COVID confinement.  IT panel (monitor, notebook, tablet) prices lagged as component shortages kept supply constrained, but peaked just two months after TV panel price peaks, and despite the industry’s insistence that we were experiencing a ‘new normal’, IT panel prices have continued to decline since.
TV panel prices not only retraced their pre-COVID lows but fell to levels that put them below cash costs for many panel producers, with the eventual result being lower panel fab utilization and in some cases panel producers went as far as to refuse orders that they believed would price out at a loss.  In October TV panel producers saw an opportunity, in that lower TV panel production had seemed to tighten the market a bit, and used that opportunity to raise TV panel prices for the first time this year.  TV brand panel buyers, with the understanding that TV panel prices were at historic lows, accepted the increase in October, however, panel producers saw that increase as a chance to salvage 4Q sales and profitability and pushed for more increases in November, as noted above.   That said, the global macro environment continued to deteriorate in November and Chinese and US holiday results were lackluster, which brings us to December where we expect that TV panel prices will be relatively flat, while IT panel prices continue to decline on continued demand weakness and panel producers will meet with resistance from buyers toward further TV panel price increases, given the uninspiring demand environment.
Picture
 
Based on or estimates for panel prices in December, assuming our scenario plays out, this was not a good year for panel prices from a y/y perspective, and while some might say that a y/y comparison is not an accurate portrayal of the cycle given the COVID pandemic’s influence, we also calculated current panel prices (December) relative to the lowest point over a 3 year period.  Current TV panel prices are the only ones that are appreciably above those lows, with the aggregate total (all categories) up less than 1% from the 3-year low set in September of this year.
Panel costs are difficult to estimate given that each model run or order are different, but the basic components and materials used in the panel production process typically allow a panel producer to reduce its costs by between 4% and 7% each year as products mature and production efficiency increases, especially as new capacity ramps up to mass production levels, but since early 2020 we have seen a considerable number of material and production costs rise rapidly, particular some of the basic materials used in displays.  Copper was among the worst, with price increases over 25% in both 2020 and 2021, , while substrate glass saw incremental price increases in almost every quarter during the same period, along with energy and labor costs.  Copper however has declined in price this year, and while down ~15% y/y, it is still up ~37% from its base price at the end of 2019.  This makes the typical cost reductions panel producers typically used to allow them to lower panel prices impossible over the last three years, and while the higher volumes and higher panel prices seen during 2020 and the 1st half of 2022 allowed panel producers to generate record profits, the battle ground has changed considerably.
Costs will continue to be an issue for panel producers heading into 2023, although the weakness seen in certain segments of the semiconductor space could give panel producers a bit of help toward cost reductions that come close to price declines, so we are a bit more optimistic about the display space in 2023, looking at it from a cost/price perspective, but we still struggle for a demand driver that could push the display space back toward profitability.  We expect less volatility toward panel pricing in 2023, and more rational behavior toward capacity expansion, particularly in China, both positives that could lead to a more stable and predictable display industry, but the display space is not noted for its stability, and we have come to expect irrational behavior from display producers as a matter of course and expect 2023 will have similar instances which could throw off our less frenetic feeling about display in 2023.
On a short-term basis, we look to the following to plan our 2023 display scenarios:
  • December TV panel pricing – Do buyers walk away from panel price increase requests in December?
  • Year-end inventory levels – The CE space has been plagued with excess supply this year, as it was slow to respond to a return to more ‘pre-COVID’ buying patterns.
  • Results from holiday buying, particularly in North America and China.
  • Results during Chinese New Year – Unless China relaxes COVID restrictions, it could be a poor Chinese New Year (1-22-23).
  • CE brand forecasts for 2023 – While these are typically made in October, we expect CE brands will postpone 2023 targets as long as possible heading into the holidays.  Hopefully those targets will be more reasonable for 2023 than they were this year, as they had to be revised 2 or 3 times, leading to rapid changes in production levels at suppliers.
On a longer-term basis we look to the following:
  • Do panel producers stick to new capacity postponements and cancellations, or do they return to the competitive over-building that is characteristic of the display space?
  • Does the Chinese government, particularly at the local level, slow display project funding?
  • Does Apple (AAPL) push into new product categories in 2023 (AR/VR) or is 2023 a ‘more of the same’ year for major CE brands?
  • Do consumers completely abandon the ‘COVID lifestyle’ and return to typical CE buying patterns or have we migrated into a ‘modified-normal’ buying pattern, with a continuation of an increased focus on mobile, or does the populous get off the couch in 2023?
  • Is inflation brought under control, giving consumers a bit of spending incentive?
All in, we expect the display space to bump along near the current cyclical bottom for the early part of the 2023 year, with some potential for a gradual rise into 3Q and 4Q, but a lot of factors (see above) need to fall into place to make that scenario work.  Do we think 2023 is going to see a cyclical upswing for the display space and CE in general?  Not likely, but difficult 2023 1H comparisons aside, we see the potential for a transition year that does not age those who follow the CE space closely more than the clock would suggest, and that would be a good thing, but we still have a way to go this year and lots of potential hiccups next, so we are applying litmus to everything we hear to maintain an unbiased position and hoping we are reading the tea leaves correctly…
Picture
Picture
Aggregate Total Panel Pricing - 2021 - 2022 - Source: SCMR LLC, OMDIA, Witsview, RUNTO, Company Data
Picture
TV vs. IT Panel Pricing - 2022 YTD - Source: SCMR LLC, OMDIA, Witsview, RUNTO, Company Data
Picture
Aggregate Monitor Panel Pricing & ROC - 2019 - 2022 - Source: SCMR LLC, IHS, Company Data
Picture
Aggregate Notebook Panel Pricing & ROC - 2019 - 2022 - Source: SCMR LLC, IHS, Company Data
Picture
Aggregate TV Panel Pricing & ROC - 2019 - 2022 - Source: SCMR LLC, IHS, Company Data
Picture
Aggregate Tablet Panel Pricing & ROC - 2019 - 2022 - Source: SCMR LLC, IHS, Company Data
Picture
Aggregate Mobile Panel Pricing & ROC - 2019 - 2022 - Source: SCMR LLC, IHS, Company Data
Picture
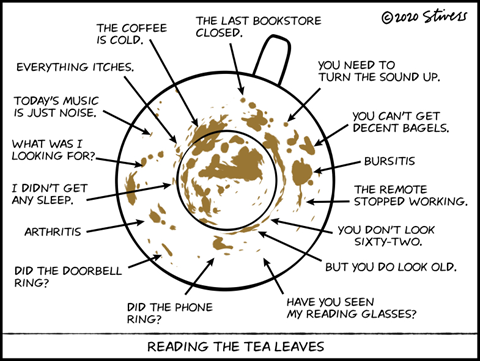
Reading the Tea Leaves - Source: MarkStivers.com
0 Comments

LCD Large Panel Shipments – October

11/30/2022

0 Comments


LCD Large Panel Shipments – October
​

After a small bounce in September, large panel shipments in October declined by 4.3% m/m (down 18.8% y/y), seemingly settling into a range around 60m units/month, where it has been since July, with an increase (↑13.8% m/m) in tablet shipments largely offsetting the decline (↓18.2%) in notebook shipments.  IT (notebook, monitor, and tablet) panel shipments declined by 5.2% m/m and by 26.5% y/y while LCD TV panel shipments declined by 2.7% m/m and 0.9% y/y.   Large panel LCD revenue declined by 3.2% m/m and 30.5% y/y, bringing large panel ASP up 1.1% for the month but still down 14.4% y/y.  China’s LCD panel producers represented 48.6% of industry revenue, and while Chinese large panel revenue growth in October was a meager 1.5% m/m (↓32.0% for YTD), China was the only region that saw revenue growth in October.  BOE (200725.CH), China’s largest large panel LCD producer represented 56.8% of revenue generated in the region, with Chinastar (pvt) and HKC (248.HK) in the #2 and #3 positions with an 18.8% and 17.9% revenue share respectively.
October is typically (5 yr. avg.) a down month for large panel LCD shipments (-3.1% avg.), so results this year were only modestly worse, however we expect November, typically an up month for shipments (+2.0% on avg.) to be weak as consumer enthusiasm continues to wane and COVID lockdowns in China limit brand shipments, leading to order cutbacks at panel producers.  If this scenario plays out, it should help to reduce inventory levels further, working toward reducing the over-supply as the holidays progress.  While we still see little hope for a demand led CE recovery as we head into the new year, there seems to be some headway being made toward maintaining lower display production levels and normalizing inventory levels, perhaps leading to a more stable, if unenthusiastic start to the new year.  With Chinese New Year coming early (1/22/23), much will depend on the COVID lockdown situation relative to Chinese CE demand, which could easily swing in either direction.  If the lockdowns are softened, we expect a bit of pent-up CE demand, but if not, we expect the Mainland will see weaker CE results than seen in the US and Europe.  It is in Xi’s hands…
Picture
Picture
Large Panel LCD Display Shipments - 2020 - 2022 YTD - Source: SCMR LLC, OMDIA, Witsview, RUNTO, Company Data
Picture
Large Panel LCD Shipments by Application - 2022 YTD - Source: SCMR LLC, OMDIA, Witsview, RUNTO, Company Data
Picture
0 Comments

Pay or Else

11/29/2022

0 Comments


Pay or Else
​

0 Comments

Best of a Bad Situation

11/28/2022

0 Comments


Best of a Bad Situation
​

​We have mentioned that several LCD and OLED panel producers have slowed or postponed decisions or plans to expand capacity over the last few months, a result of the macro inflationary environment and the concurrent lack of consumer spending.  While Chinese panel producers still have groundbreaking ceremonies and sign both letters of understanding and form new entities with local governments to build out existing or add local LCD or OLED capacity, the realities of the current situation tell a somewhat different story.  Chinastar (pvt), a subsidiary of TCL (000100.CH) has been building its T5 fab since the middle of last year, originally to be a Gen 6 OLED fab, with the possibility that it could change to an LCD fab for IT products and a micro-LED backplane line. 
As the display and CE market deteriorated this year Chinastar, while having ordered a considerable amount of fab equipment form a variety of vendors, seems to have pushed out the delivery dates, some of which were to have been delivered this month.  Two South Korean equipment suppliers indicated that they had seen such delays for contracts with near-term delivery dates, totaling $24.2m US, one of which seems to have been pushed into late 2023 (unconfirmed), and the potential micro-LED project seems to have been indefinitely postponed.  While last year panel producers were competing with semiconductor manufacturers for equipment for the TFT portion of display production, causing unusually high demand and long delivery schedules, display tool vendors are now putting the breaks on those deliveries, causing serious problems at equipment vendors who have invested in materials and labor but cannot claim customer acceptance.
While these issues are devastating to LCD and OLED equipment manufacturers, the postponement or cancellation of potential capacity expansion projects is a positive for the industry, albeit a bit later than hoped.  With little demand expansion expected for the display space over the next year, and the expansion of new product categories, such as AR/VR and Micro-LED still a few years out, there is little need for greenfield capacity, unless it is dedicated, such as has been the case with Apple (AAPL) and LG Display (LPL) in years gone by.  But with a number of OLED panel producers chasing the same potential future Apple business, and the thought that the automotive display business cannot be supported by existing capacity, has pushed some to set capacity goals a bit unrealistically. 
While most expansion plans are rarely fully cancelled (it does happen), most slow considerably or change from one display modality to another as display perspective change, and delays or postponements of new capacity currently serve to tighten the supply side of what is an unbalanced equation currently.  Without a return to the incremental demand seen during the height of the COVID pandemic, or a more conducive spending environment, the display and even the entire CE space must focus on supply, at least for the 1st half of 2023, so we view any delays and postponements as a positive, despite the implications for tool vendors and similar suppliers, as it seems better to take a short-term hit than to live through an extended downturn that could impact the entire industry.  It’s the best of a bad situation.
0 Comments

AR/VR Display Primer

11/15/2022

0 Comments


AR/VR Display Primer
​

AR/VR is a controversial subject in the CE space, with some CE companies making big bets on the technology, while others are still skeptical as to the validity of the technology as a competitor to more typical visual modalities.  We understand that those who have a stake in the AR/VR world will be far more optimistic about its prospects than the average Joe, and we therefore take most forecasts, especially those in the out years, with a grain of salt, and rightly so as estimates, even for this year, have come down considerably.  For example an estimate made in 2020 for XR unit shipments in 2025 has been reduced from 43.5m units to 23.8m units, with similar changes in earlier years.  That said, our attention to the space is predicated on the eventual adoption of XR by a number of major CE companies, whose motivation is not to promote a ‘new world’ or lifestyle, but to sell devices, assumedly the goal of all CE companies.
We do believe that the adoption of XR will be somewhat generational, with those that have grown up with smartphones as an extension of their bodies and personalities more willing to accept the notion of XR without the trepidation that comes from a generation that grew up with radio and TV as ‘social media’, and that will take time, but we believe the adoption of XR by Apple (AAPL) will help to legitimize XR and push it further into the more consumer oriented spotlight.  We do see a bit of a divergence between the two components of XR, with AR being the more practical application and VR having a more entertainment oriented focus, although AR will continue to have a smaller share of the XR unit total at least for the next year or so.  We also expect the two segments to merge somewhat, with a number of devices allowing the user to use the headset as an AR device, while also providing for a ‘blocking’ system that will allow the user an immersive VR experience.
Aside from the potential usage characteristics for XR, there is another important aspect of XR devices that needs to be addressed, that of ‘wearability’, and by wearability we do not mean how comfortable a headset might be but more how it looks to the outside world.  We have all seen pictures of those wearing VR headsets wildly gesticulating as they stand in the middle of a room or sit on a couch, and that is certainly an image that does not serve to entice a broad swath of consumers to try such a device, although it is likely quite attractive to the gaming population.  More to the point would be AR headsets, which are slowly evolving into devices that are close to normal glasses, thanks to optical solutions like pancake lenses, that reduce the bulk behind AR headsets, which makes them more practical for their use as an ‘everyday’ item that can be worn without the stigma of a VR headset, and will eventually become unobtrusive to consumers.
Of course there are many practical applications for both AR and VR, but while VR unit volumes are substantially higher than AR unit volumes, we see AR as the more ubiquitous device for the long-term, especially from a generational standpoint, with the information currently presented on a smartphone display projected in front of you, without blocking normal vision, a way of reducing the need to look at a screen that you have to take out of a pocket as it is always on and in front of you.
Right now, we have to look at the XR space more from the standpoint of a typical consumer device, and as almost all consumer devices have a visual interface, we start with the displays that have been and will be used in AR and VR devices.  There are a number of existing and potential displays that have been and can be used in AR and VR devices, so we offer a bit of a primer on what they are, how they work, and our data on which are gaining or losing traction.  We note that these displays tend to be more complex to manufacture than smartphone displays, particularly as they are situated within millimeters of the user’s eyes, making the resolution and pixel pitch[1] key metrics.  Such displays are considered ‘near-eye’ displays and while they are typically produced on display production lines similar to those used to produce CE displays, their characteristics are pushing the technology needed to satisfy near-eye criteria toward less typical production methods.
Most CE displays are based on a glass or plastic substrate, and while those platforms are certyainly acceptable for typical CE displays, the higher tolerances of near-eye displays have pushed development toward silicon-based displays, which are just beginning to show merit as to reducing the feature sizes needed for near-eye displays.  What makes this even more attractive to display producers is the processes use equipment that display producers already have on the fab floor, particularly semiconductor lithography tools that are used to make display TFT backplanes.  This gives the DoS (Display on Silicon) world a path into the future that requires potentially less capital and infrastructure than would be the case for a ‘new’ display technology, and gives the industry an easier path to building pilot DoS lines to further develop the technology.
That said, the AR/VR industry still has the necessity of having access to mass production that can keep costs at reasonable levels and that tends to lean toward existing display modalities, so we looked at all of the AR/VR devices produced since 2013 and traced the display types used in those devices.  Not all of the device manufacturers have been forthcoming about the type of display used, so there is an ‘unknown’ component, but we broke down the display usage into groups for those that disclosed the information, using the manufacturers ‘classification’ as to the type of display.  In some instances there were nuances that made us wonder if the AR/VR brand was accurately portraying the dive display, but without disassembling a multitude of AR/VR headsets, we took the brand’s word at face value.
This broke down the displays into eight categories based on four technologies, Liquid Crystal displays (LCD), OLED displays, LED displays, and DLP, which we describe in brief below.
  • Liquid Crystal Display (LCD) – A display in which light is generated by a BLU (backlight unit), which passes through or is blocked by a liquid crystal material.  The liquid crystal is ‘controlled’ by TFT (Thin-film Transistors) circuitry that can shift the optical characteristics of the liquid crystal to let the light through or block it.  If the liquid crystal is ‘open’, the light passes into a color filter, essentially a sheet of red, green, and blue phosphors that change the white backlight to their respective colors.
  • OLED Displays (OLED) – A display that uses phosphorescent and fluorescent materials that emit light when controlled by a TFT system similar to that used in LCD displays.  In small OLED displays, the OLED materials are arranged to form a pixel composed of red, green, and blue OLED materials, each of which can be individually controlled.  Since these materials are self-emissive, there is no need for a color filter.
  • LED displays (LED) – As mentioned above, LCD displays require a backlight that is usually an array of LEDs (Light-emitting Diodes), and in most cases the term ‘LED display’ is used to mean an LCD display that uses an LED backlight, however, there are also display technologies that are based on the LEDs themselves as emitting devices.  In some cases individual red, green, and blue LEDs are used as self-emissive components, similar to the way OLED materials are used, and in other instances single color LEDs are used, using a number of methods for converting the color of the light (more below).
  • DLP (Digital Light Processing) – This technology uses a white light source that is split into primary colors.  Three micro-mirror chips for each pixel, which are individually controlled, reflect the prism’s light or block it, to create each pixel’s color combination.  More commonly used in cinema projection systems, the technology is rarely used in near-eye devices.
While those are the main near-eye display categories, there are a number of ‘flavors’, as noted below:
  • Mini-LED – Essentially an LCD display, but with much smaller LEDs in the backlight, giving a higher level of control over each pixel.
  • QLED (Quantum Dot) – Similar to the Mini-LED above, these displays use quantum dots to narrow the spectrum of the LED light and enhance the color characteristics.  In some cases, the quantum dots can be used as a substitute for the color filter, shifting the white light to red, green, and blue, rather than filtering to preserve brightness.
  • LCoS (Liquid crystal on Silicon) – Similar to DLP and LCD, LCoS uses liquid crystal to reflect or block the RGB light sources, and is based on a silicon substrate.  LCoS is also used for projection devices but has been used in some near-eye displays.
  • Micro-LED – Micro-LED displays are based on self-emissive LEDs that are either a single color or have a red, green, and blue LED for each pixel.  In single color micro-LED displays quantum dots are typically used to shift the single color light to RGB as RGB micro-LEDs are relatively difficult to produce.
  • Micro-OLED – Similar to more typical self-emissive RGB OLED displays, micro-OLED displays are produced on silicon and do not use typical evaporative OLED material deposition.  While there are a number of potential micro-OLED processes, rather than the masks used to create pixels with OLED materials, micro-OLED displays are created using photolithography on silicon.
  • eQD – While not in our data for existing AR/VR headsets, we note that at some point in the future we expect that quantum dots will also be used as a self-emissive light source, likely based on silicon photolithography.  Right now QDs are typically used as ‘color shifters’ converting one color of light to another, a step above phosphors which filter out other colors.  By electrically or optically stimulating QDs, they give off light that is easily tailored to specific colors.  Not yet a product but one that will inevitably be used in near-eye displays.
As noted above, we traced the evolution of Ar and VR display technology back to the early days of XR and mapped the progress (or demise) of each technology according to the number of devices that used the technology.  This data is not unit based in terms of units sold but based on the technology share of the number of models available to consumers on a yearly basis.  While this would not be a basis for determining which technology ‘sells’ the most units, it does show trends, especially the right-hand column noted as ‘unreleased’.  This represents those AR and VR devices that have been announced but have yet to be released and would represent the (hopefully) leading edge of AR/VR display technology.  While Figure 1 and Figure 2 show the composite AR/VR Display history and Figure 3 shows the combined totals, the AR/VR Display History Individual Charts (Figure 4 - Figure 12) tell more of a story.
LCD is still the Oculus 2 (FB), the only release in 2014 contained an OLED display, giving it dominance that year, and while OLED has seen its share decline in both AR and VR over the last few years, Figure 11 shows that Micro-OLED is gaining traction over the last two years, and in those devices still unreleased.  Mini-LED, Micro-LED and QLED near-eye displays are still in the emerging category, while DLP has disappeared.  LCoS, as a reflective technology remains viable for AR (Magic Leap (pvt)), but we expect micro-OLED and modern optics will lessen its appearance.
Once again, we note that regardless of the forecasts for XR, the CE space is always looking for new hardware to sell, and while AR/VR is a bit different than your usual CE fare, it has the potential to become another revenue source for CE companies and the display industry.  As few CE devices are not display oriented in some way, we focus considerable attention to the display space to spot trends, both in the near-term and on a long-term basis.  Should a large CE company decide that XR is a viable consumer product, the media will blast the web with headlines about the merits of AR/VR and how it will change the world and the way we see it.  Therefore, we look to keep one step ahead and look to spot trends and direction that will move the XR space ahead or delay its (2nd or 3rd) ‘dawning’.


[1] Pixel pitch is the distance from the center of a pixel to the center of an adjacent pixel and is usually measured in millimeters or microns.
Picture
AR/VR - Display History - AR Composite - Source: SCMR LLC, Company Data
Picture
AR/VR - Display History - VR Composite - Source: SCMR LLC, Company Data
Picture
AR/VR - Display History - XR Composite - Source: SCMR LLC, Company Data
Picture
AR/VR - Display History - LCD - Source: SCMR LLC, Company Data
Picture
Picture
AR/VR - Display History - DLP - Source: SCMR LLC, Company Data
Picture
AR/VR - Display History – Mini-LED - Source: SCMR LLC, Company Data
Picture
AR/VR - Display History - QLED - Source: SCMR LLC, Company Data
Picture
AR/VR - Display History - LCoS - Source: SCMR LLC, Company Data
Picture
AR/VR - Display History – Micro-LED - Source: SCMR LLC, Company Data
Picture
AR/VR - Display History – Micro-OLED - Source: SCMR LLC, Company Data
Picture
AR/VR - Display History - Unknown - Source: SCMR LLC, Company Data
0 Comments

And the Beat Goes On

11/11/2022

0 Comments


And the Beat Goes On
​

0 Comments

Taiwan Display October Results

11/9/2022

0 Comments


Taiwan Display October Results
​

As we previously noted, October LCD panel pricing was mixed with TV panel pricing up 4.5% and combined aggregate IT panel pricing down 1.6%, which implies that panel producer results will be quite dependent on the overall mix of orders.  TV panel revenue for most panel producers has been declining as a percent of the total, given the rapid TV panel price declines that have been evident since July of last year so the TV pricing leverage will be relatively small, although AU Optronics (2409.TT) saw its 3rd consecutive monthly improvement is sales, while competitor Innolux (3481.TT) did not, after a sales jump last month.  Hannstar (6116.TT), primarily a small panel producer, saw a m/m improvement in sales after a weak September, but continuing the downward trend of sales for the year.
While m/m results are looking a bit better for Taiwan LCD panel producers, we expect they will, bounce along the bottom for the remainder of the year, with the objective being to lower inventory levels and attempting to only take orders for lots that are priced above cash costs.  Taiwanese based LCD supply chain participants tend to be focused on making aggressive inventory adjustments before year-end to enhance year-end financials, and weakness coming from Chinese COVID lockdowns will all likely contribute to a lackluster 4Q.  That said, there is some hope that the inventory reductions underway will keep the seasonally slow 1st quarter from being a disaster, but without a demand driven recovery, it would be hard to make the case for anything but a relatively flat 1Q.  
Picture
Picture
AU Optronics Monthly Sales - 2018 - 2022 YTD - Source: SCMR LLC, Company Data
Picture
nnolux - Monthly Sales - 2018 - 2022YTD - Source: SCMR LLC, Company Data
Picture
Hannstar Monthly Sales - 2018 - 2022 YTD - Source: SCMR LLC, Company Data
0 Comments
<<Previous
Forward>>

    Author

    We publish daily notes to clients.  We archive selected notes here, please contact us at: ​info@scmr-llc.com for detail or subscription information.

    Archives

    May 2025
    April 2025
    March 2025
    February 2025
    January 2025
    January 2024
    November 2023
    October 2023
    September 2023
    August 2023
    June 2023
    May 2023
    February 2023
    January 2023
    December 2022
    November 2022
    October 2022
    September 2022
    August 2022
    July 2022
    June 2022
    May 2022
    April 2022
    March 2022
    February 2022
    January 2022
    December 2021
    November 2021
    October 2021
    September 2021
    August 2021
    July 2021
    June 2021
    May 2021
    April 2021
    March 2021
    February 2021
    January 2021
    December 2020
    October 2020
    July 2020
    May 2020
    November 2019
    April 2019
    January 2019
    January 2018
    August 2017
    July 2017
    June 2017
    May 2017
    April 2017
    March 2017
    February 2017
    January 2017
    November 2016
    October 2016
    September 2016

    Categories

    All
    5G
    8K
    Aapl
    AI
    AMZN
    AR
    ASML
    Audio
    AUO
    Autonomous Engineering
    Bixby
    Boe
    China Consumer Electronics
    China - Consumer Electronics
    Chinastar
    Chromebooks
    Components
    Connected Home
    Consumer Electronics General
    Consumer Electronics - General
    Corning
    COVID
    Crypto
    Deepfake
    Deepseek
    Display Panels
    DLB
    E-Ink
    E Paper
    E-paper
    Facebook
    Facial Recognition
    Foldables
    Foxconn
    Free Space Optical Communication
    Global Foundries
    GOOG
    Hacking
    Hannstar
    Headphones
    Hisense
    HKC
    Huawei
    Idemitsu Kosan
    Igzo
    Ink Jet Printing
    Innolux
    Japan Display
    JOLED
    LEDs
    Lg Display
    Lg Electronics
    LG Innotek
    LIDAR
    Matter
    Mediatek
    Meta
    Metaverse
    Micro LED
    Micro-LED
    Micro-OLED
    Mini LED
    Misc.
    MmWave
    Monitors
    Nanosys
    NFT
    Notebooks
    Oled
    OpenAI
    QCOM
    QD/OLED
    Quantum Dots
    RFID
    Robotics
    Royole
    Samsung
    Samsung Display
    Samsung Electronics
    Sanan
    Semiconductors
    Sensors
    Sharp
    Shipping
    Smartphones
    Smart Stuff
    SNE
    Software
    Tariffs
    TCL
    Thaad
    Tianma
    TikTok
    TSM
    TV
    Universal Display
    Visionox
    VR
    Wearables
    Xiaomi

    RSS Feed

Site powered by Weebly. Managed by Bluehost