Supply Chain Market Research - SCMR LLC
  • Blog
  • Home
  • About us
  • Contact

China Smartphone Shipments - Preliminary

5/2/2022

0 Comments


China Smartphone Shipments - Preliminary
​

​While unconfirmed by the Chinese government (longer than usual delay) we expect March smartphone shipments were ~24m units, below the 29m units we had expected.  This would put 1Q smartphone shipments in China at 71.9m units if confirmed.  While this is a 61.5% increase on a m/m basis, it represents a 33.5% decline y/y and is the 8th quarter in a row of declining y/y smartphone shipments in China.  We will publish charts when the data is confirmed by the Chinese government.  2Q, based on potential COVID-19 lockdowns, is expected to be down 5% to 6% y/y, although there is little that these estimates are based on given the stringent restrictions China places on COVID-19 breakout cities.
0 Comments

OLED Smartphone Shipments & More…

4/11/2022

0 Comments


OLED Smartphone Shipments & More…
​

Small panel shipments, essentially those for smartphones, can be a difficult business for panel producers as it is not only a highly competitive market but one that has become bisected by two opposing technologies.  Traditionally, LCD displays have been used in smartphones, but over the last few years OLED smartphone displays have become quite important to smartphone brands, especially in flagship or premium priced phones.  The number of colors a display can reproduce is not determined by the type of technology used but the number of shades of each color (red, green, blue) that the display can reproduce (known as bit depth)., with the standard being 8 bits or 16.777m colors[1].  OLED displays however are self-emissive, meaning each red, green, and blue sub-pixel can be off completely, on completely, or a number of gradations between the two, which, in theory provides infinite contrast[2].  LCD sub-pixels contrast is controlled by the backlight that shines through or is blocked by the liquid crystal, however there are far fewer LED backlight ‘sources’ than there are LCD sub-pixels, so if an image calls for a black area right next to a white area (such as a star field) the black area will appear grayish rather than pure black as the LED behind both pixels will be on for the white ‘star’.
This gives OLED displays an advantage over LCDs in terms of contrast, and RGB OLED displays also have a faster response time, keeping fast moving objects from smearing or leaving trails as they move across the screen, which can be a problem for LCD displays, but OLED displays do have some issues, primarily they do not usually produce as much light (brightness) as LCD displays.  As the OLED material itself is generating the light, the OLED material itself determines the basic brightness of the display, while LCD display brightness is basically determined by the brightness of the LED backlight[3], so it is incumbent on OLED material suppliers to constantly improve such materials to compete with LCD small panel displays.  OLED RGB displays also have another issue in that the three OLED materials used to create colors do not age at the same rate.  This can cause an effect called ‘burn-in’ that creates ‘ghost’ images of banners or other images that remain on the screen for an extended time, such as a logo on a news show.
But even with these issues, OLED displays have become popular enough to dominate the premium smartphone category and take a significant share of the total smartphone market, a bit over 40% depending on the source.  We estimate that between 615m and 620m small panel OLED displays were shipped last year, up 20.8% over 2020 shipments and representing 45.7% of mobile device shipments based on our composite smartphone shipment totals, an increase from 39.6% in 2020.   However much has been said recently about how Chinese small panel OLED display producers have been gaining ground against the incumbent leader, Samsung Display (pvt), and as the dominant supplier of small panel OLED displays, it is inevitable that SDC’s share of that market will be reduced as other producers ramp production capacity and develop the expertise needed to maintain acceptable yields.
We believe that SDC’s share of the composite[4] small panel OLED market decreased last year from 77.6% to 70.5%, although SDC’s unit volume increased over the same period by 9.8% while all other producers gained share and expanded unit volumes.  As referenced below, there are both rigid and flexible OLED small panel displays in those numbers and a bit more granularity can be determined, especially as flexible small panel OLED displays carry higher ASPs, making them more lucrative for those that are generating high enough yields and utilization to remain profitable.  Looking specifically at flexible small panel OLED displays only, there was more intense competition from suppliers and SDC’s share in 2021 declined to 56.9% from 68.3% in 2020, although again, SDC’s actual flexible small panel OLED shipments grew in 2021, despite the share loss. 
The problem is scale, and while the flexible small panel OLED market saw a 28.2% increase in shipments in 2021, SDC’s growth was below overall industry growth because of its size.  The same goes for the composite small panel OLED market shown in Figure 6 and follows in the rigid small panel OLED category also, where SDC has an even bigger share (83.7% in 2021 down from 88.0% in 2020).  Samsung has the choice of further expanding small panel OLED capacity to continue to maintain share, or concentrate on higher value small panel OLED products.  A continued domination of small panel flexible OLED products would seem to be the proper goal, but SDC has taken it one step further and has become the dominant force in foldable OLED displays, which carry an even higher price premium than flexible small panel OLED displays, which tells us that SDC’s advanced planning for small panel OLED tends to be far ahead of most others.  Of course, it is easier to make such decisions when you are as large as SDC and have a parent who is among the top smartphone suppliers globally, but SDC has to make such decisions in a vacuum and cannot anticipate how fast they will progress down the learning and profitability curve and whether their assumptions about small panel flexible OLED pricing are correct as to price and timing. 
While others proclaim the loss of share as the end of the Samsung Display ‘era’ we point to the LCD large panel space where Chinese panel producers have built out significant capacity and now hold a dominant share of the large panel LCD market.  While this was a good strategy for much of 2020 and part of 2021, we look at a longer-term view and expect that the small panel ‘generic’ flexible OLED market will become crowded more quickly than expected, and competition, even between Chinese producers will become even more intense.  While SDC will lose more small panel flexible OLED in 2022, the real question is whether they will maintain profitability growth in a static pricing environment and whether that will hold true in a weak pricing environment.  The idea is to make money, not wave a flag, so we are still on the side of the SDC philosophy, even if it means losing share.


[1] Example: Adding 2 more bits of information to each of three colors changes the possible color combinations from 16.777m possible color combinations to a staggering 1.073b color combinations.

[2] Contrast: The difference from the deepest black and the whitest white,

[3] Brightness in LCD RGB displays is also reduced by the color filter used to generate each colored sub-pixel.

[4] Both rigid and flexible small panel OLED displays.
Picture
Composite Small Panel OLED Unit Volume & Growth Rate - 2020 - 2021 - Source: SCMR LLC, Stone Ptrs, Samsung Display, Company Data
0 Comments

Underestimation

4/8/2022

0 Comments


Underestimation
​

​Back in 2019, at the height of the Trump administration’s anti-China hysteria, the US Congress passed Public Law 116-124, otherwise known as the Secure & Trusted Communications Network Act of 2019,that prohibited the use of federal funds toward the purchase of communications equipment or services from companies that pose a national security risk to US communication networks.  As part of the requirements, the FCC published a list of equipment and services that would be prohibited by this law and communication providers were required to justify any such purchases to the FCC, with equipment from Huawei (pvt) and ZTE (000063.CH) being the focus.  The bill also established a reimbursement program that would supply small providers (less than 2m customers), with funds to offset the cost of replacing such equipment.
The bill required that carriers that qualify make initial reimbursement cost estimates to the FCC and allocated $1b as a starting figure for the reimbursement fund, while giving carriers only 1 year from the date of funding to make the replacements, although the FCC was given the ability to grant 6 month extensions on an individual basis.  Based on the initial applications, the capital allocation was raised to 1.89b in 2020.  At the time of the initial applications there were 52 company submissions, however by January of this year that number increased to 181 as more companies found they could meet the necessary qualifications, but at the same time the number of applicants was increasing, so were the estimated costs for the removal and installation of qualified equipment.  Based on current FCC estimates after the recent review, the cost has now risen from 1.89b to $5.6b, which leaves a funding gap of ~$3.7b, with some of the blame resting on the ‘equipment replacement cost catalog’ that the FCC initially provided to help early applicants cost out the replacement.  It seems that the FCC did not do the complex cost analyses done by the carriers that includes modifications to cell towers or the replacement of downstream equipment to make it compatible with the replacements.
There are likely overestimations at the carrier side in order to protect them from potential problems during the transition, but few expect that the new $5.6b estimate will be reduced significantly, and with the continuation of silicon shortages and the rising cost of materials overall, some carriers are holding back the progress of the replacement cycle in order to see if the Congress will fund the higher amount, especially since major US carriers will be spending more this year and next for 5G mid and C-band rollouts.  If the money doesn’t get allocated by Congress, it could slow the replacement project to a crawl as we doubt smaller carriers would be able to foot the bill themselves and larger carriers will focus capital spending on revenue producing 5G capacity.
0 Comments

It’s Complecated…

4/5/2022

0 Comments


It’s Complecated…
​

​While Huawei (pvt) and ZTE (000063.CH) have already been sanctioned by the US government over alleged collusion with the Chinese government, there are a number of Chinese smartphone and telecom companies that have not, some of whom sell products in the US and Europe, but there is the possibility that new sanctions might be imposed on some Chinese brands as they sell products into Russia during the Ukraine invasion.  The Chinese government has taken the stance that it does not believe that sanctions against Russia have any basis in international law and will create more problems than they solve, leaving Chinese smartphone producers to continue to sll product in Russia.
Russia’s largest mobile operator MTS () has indicated that sales of Huawei smartphones jumped 300% during the first two weeks of March, along with triple digit growth from Chinese brands Oppo (pvt) and Vivo (pvt).  While these brands are hard to find in the US, Oppo and Vivo are both typically found among the top 5 brands globally, so the possibility of US sanctions, which would preclude any company (globally) from producing or selling same if they are produced with any US equipment or software (hard to imagine that is not the case).  If the US were to sanction these companies for selling in Russia, it could create a very difficult business situation among US supporters in Europe and Asia.  That said we have seen a number of companies in the US that have indirect ties to Russia be criticized and social media will continue to press those connections.  While sanctions against Russia make us feel that we are doing something for the people of Ukraine, they have implications that wind even more deeply through the US economy and the US political system.  It’s complicated…
0 Comments

Smartphones in 2021

3/30/2022

0 Comments


Smartphones in 2021
​

While it might not have seemed so during much of last year, 2021 was a good year for smartphones on a global basis, and while there are certainly disagreements as to the growth rate of shipments last year (range among sources is 1.0% to 8.9% y/y) it seems everyone has agreed that for the first time since 2017 smartphone shipments grew on a y/y basis.  As we are data source ‘agnostic’ and are wary of outliers, we gather as much source data as possible and average the data to come up with what we believe is a consensus for yearly smartphone shipments, as shown in Figure 1, an increase of 4.7%. 
That said, there has been much comment on what drove smartphone shipment growth in 2021, with much speculation on the ‘premium’ price category.  Since ‘premium’ is a subjective term and is defined differently by data sources, we do not give as much weight to subjective data as we might to objective data, however before we go further, we note that 2020 was an aberrational year due to COVID-19, and based on the trend in the two previous years (2018 – 2019) we estimate that 2020 came up 119m units short.  If we consider 2021 shipments inclusive of that pent-up demand, 2021’s ‘normalized’ smartphone shipments would have been 1.238m units, or down 4.5% y/y rather than up 4.7%, and while this is an exercise rather than an actual estimate, it shows that headlines pointing to the growth of smartphones in 2021 need to be examined further, and even on face value are still down 5.4% from 2019, the year before the COVID-19 pandemic, which might change the word ‘recovery’ in tech headlines to ‘bounce back’.
There were other factors that played into unit shipment growth in 2021, primarily 5G phones, which began shipping in 2019 in small quantities but saw rapid share increases in subsequent years, particularly in China where 5G base station implementations were strongest.  While 5G smartphones currently represent just under 80% of all smartphones shipped in China (less globally), they are just over 50% of new models, which led us to look more closely at a different metric than units shipped.  Taking ‘models’ a bit further, a number of data sources have focused smartphone growth in 2021 on the ‘premium’ category, again a subjective term, so while we did not disaggregate smartphone shipments by price tier for 2021we looked at what we call ‘model availability’ or the number of models available to consumers in each price category over the last 4 years. 
Rather than break down price tiers into subjective categories, we used $100 increments to eliminate all bias and we include data from 1Q ’22, which we annualize to show what this year might look like, although seasonality is not considered.  Again, these are not shipments but the number of smartphone models available to consumers across all brands.  Based on that data it can be seen that the number of smartphone models in the $100 - $200 and the $200 - $300 price tiers has continued to grow from 49.9% of total models in 2019 to 54.5% of total models last year and the top two price categories, $1,000 - $1,200 and $1,200+ saw model availability growth last year of 4.4%, as Samsung’s success with foldables give more high-end choices to consumers.
Rather than make our own subjective categories, we then took the 12 price tiers and created low, mid, and high price tier categories by taking 4 price points each from the data.  Looking at this data (see Figure 4) the lowest price tier has seen the number of models available to consumers rise over the last three years, albeit marginally, the mid price tier has seen the number of available models decrease and the highest price tier has been less consistent, although it increased in 2021.  This data, while it does not relate directly to shipments, it does give some hints as to brand positioning and consumer demand, and could be applied more readily to sales value data, but while headlines read that ‘premium’ smartphones were leading the recovery last year, our data shows a bit less enthusiasm for high end smartphones and a steady demand for low end smartphones.   All in it is another few data points in the battle to lessen the impact of headlines on investors in the CE space and make data more reliable.
Picture
Global Smartphone Shipments & ROC - 2017 - 2021 - Source: SCMR LLC, various
Picture
- Smartphone Model Availability By Price Category - Source: SCMR LLC, GSMArena, Company Data
Picture
Smartphone Model Availability Price Share By Year - Source: SCMR LLC, GSMArena, Company Data
Picture
- Smartphone Model Availability - Broad Tier - By Year - Source: SCMR LLC, GSMArena, Company Data
0 Comments

The “Putinphone”?

3/28/2022

0 Comments


The “Putinphone”?
​

Samsung and Apple have stopped shipping smartphones to Russia.  Given that Russia is among the largest smartphone markets (6th globally as measured by number of users) and has the 2nd highest adoption rate based on population, this is a significant blow to both brands.  In term of vendor share currently Apple holds a slight lead over Xiaomi (1810.HK) and Samsung, with Huawei (pvt) and RealMe (pvt) with lower shares, and Android is the obviously dominant smartphone OS.  Google has stopped Russian users from making purchases from the Google Play Store or YouTube although free apps will still be available, and Russian state-owned media outlets have also been banned. 
This has set the Russian government toward the potential that Google will cut off all Android support to Russian smartphone users or will limit licenses for new phones and has pushed the government to examine other operating systems going forward, including Huawei Harmony OS, which is the alternative OS used by Huawei in China, after its ban from trade with the US.  Huawei has indicated that while it has sold 220m devices with their OS, they have no plans to sell any phones with the Harmony OS overseas.  Unfortunately, that does not rule out the licensing of the OS to others, such as Russian smartphone producers, who can use it in their phones to replace Android going forward, giving Huawei an income stream without selling phones into the country.
That said, the Russian government is urging citizens to not worry about Google, Samsung, or Apple and purchase the domestically produced smartphone, the AYYA T1, which was developed by Smartecosystem (pvt) a division of Rostec, (State Corporation for Assistance to Development, Production, and Export of Advanced Technology Industrial Product Rostec), a state-owned organization created by V. Putin in 2007.  The phone uses a Mediatek (2454.TT) Helio processor and has a 6.5” screen, with the retail version running on Android while other models are available with the Aurora OS, developed by Jolla Ltd (pvt), a Finnish company, although the code is open-source.  The AYYA’s claim to fame is that the phone has a button that disables both the cameras and the microphone to allow users to be free of potential surveillance.  The phone sells for what was 15,000 to 19,000 rubles, which at the beginning of this year was equivalent to $170 - $255 US, although now is between $156 and $198.
 
Picture
Top Smartphone Markets by Users & Penetration - 2021 - Source: SCMR LLC, Statista.com
Picture
Top Smartphone Vendors in Russia - Source: SCMR LLC, StatCounter
Picture
AYYA T1 - Source: AYYA
0 Comments

LG Completes Sale of Smartphone Business

3/28/2022

0 Comments


LG Completes Sale of Smartphone Business
​

​LG Electronics (066570.KS) which withdrew from the smartphone business last year, has completed the sale of the business, after converting smartphone production lines in Brazil, India, and Vietnam to home appliance production, and selling the lines in China to affiliates of Inspur Group (600756.CH), a large server company based in Jinan, China, who was said to have ties to the People’s Liberation Army, which precludes US companies or investors from owning its shares.  We believe LG owns 30% of the JV that was set up to encompass the sale with Inspur having been responsible for the production of a portion of LG’s low-end smartphones in the past. 
The lines in other countries were originally to be sold however it was found that there were few buyers that had the need or financial capacity for the lines, while the Inspur sales was easily accomplished due to the existing relationship.  LG had contemplated selling the entire mobile division last year to a number of possible global scale buyers but decided to hold onto the IP, a portion of which is related to 5G, which the company says can be applied to a number of affiliated businesses outside of smartphones.  Since then there have been a number of IP sales made by LG, one being through affiliate LG Innotek (011070.KS) to Scramoge Technology (pvt), a non-practicing IP holding company in Ireland that is known for it’s lawsuits against major CE companies, and a number of licensing agreements with Chinese smartphone brands.
0 Comments

China Smartphone Shipments Fall in February

3/24/2022

0 Comments


China Smartphone Shipments Fall in February
​

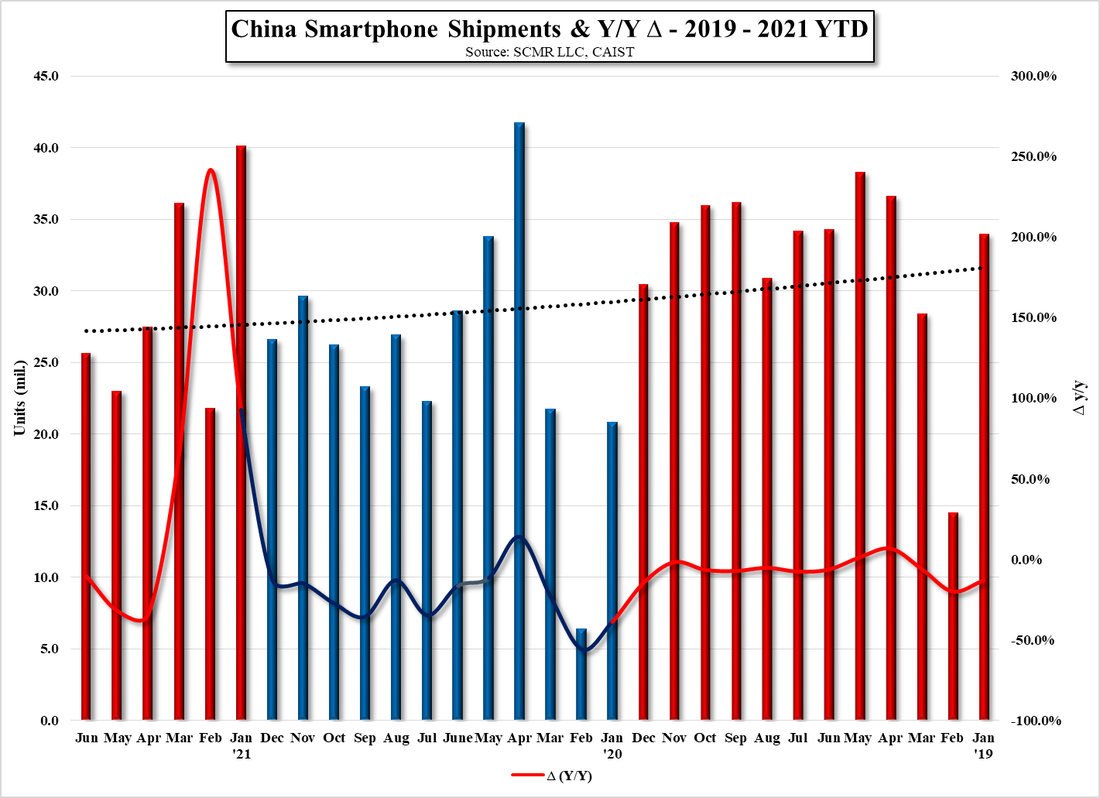
Overall mobile phone shipments in China fell to 14.86m units in February, down 55.0% m/m and down 31.8% y/y.  Given that the 5 year average m/m shipment decline is -52.6% the sequential decline is right in line with the averages, however the y/y decline far exceeds the 5 year average of +32.3%, as it includes last year’s 241.5% y/y increase in February, which followed January 2021’s y/y increase of 92.7% and the March 2021 increase of 65.9% y/y, all of which represents the rebound in the Chinese smartphone market seen last year after four years of declining shipments.  That said, while we have yet to change our overall estimate for Chinese smartphone shipments in 2022, we remain a bit more cautious as to the strength of the recovery.  We do expect that the recent outbreaks of COVID-19 in China might have slowed shipments a bit more than expected, given the lockdowns in a number of large cities on the Mainland, but we had expected slightly better results for February.
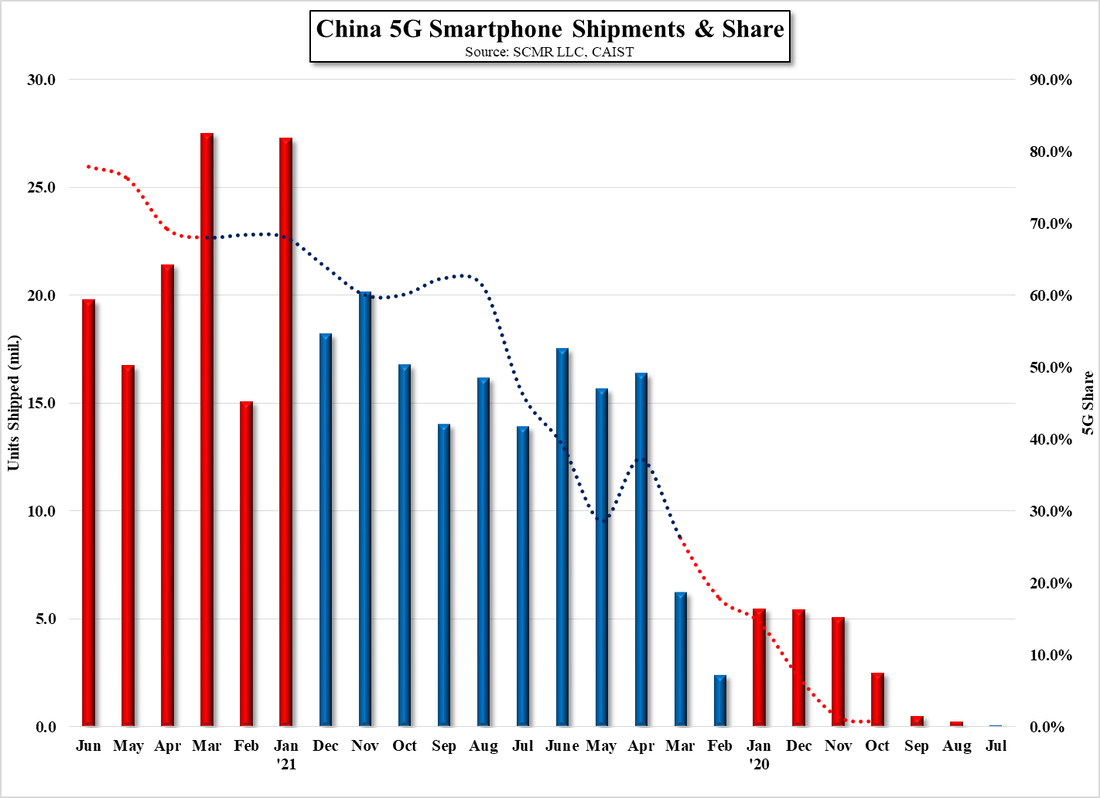
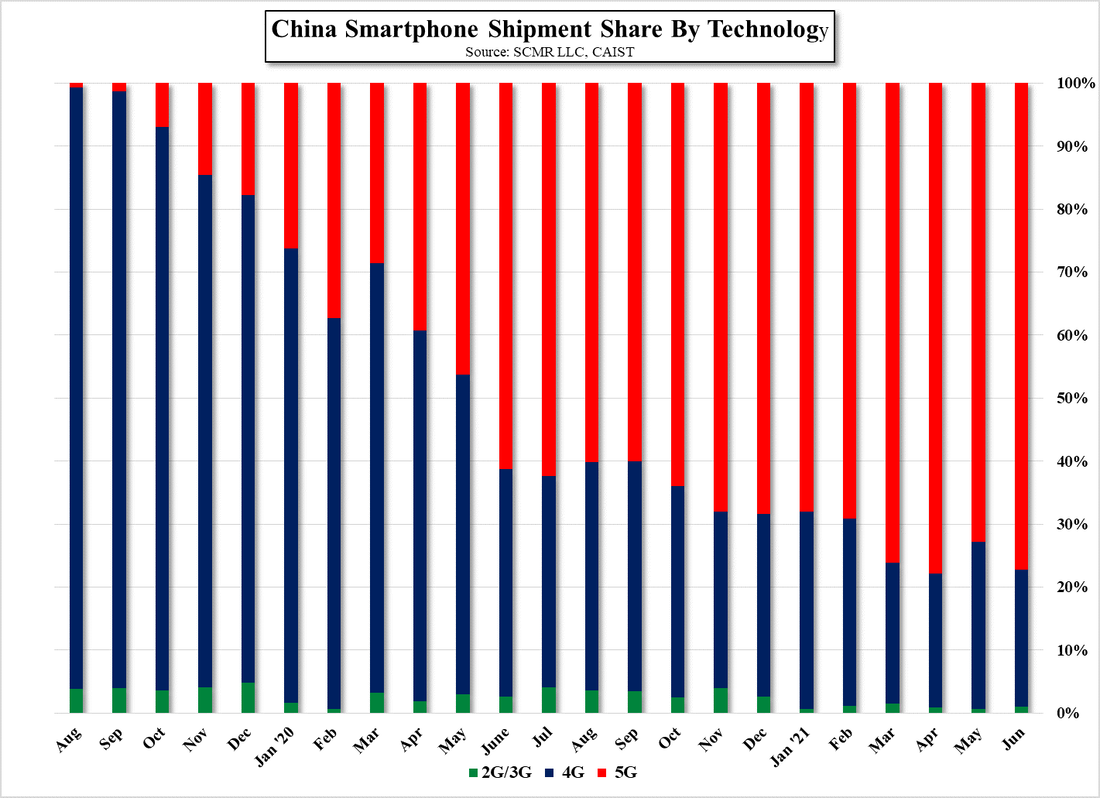
5G smartphone shipments in China were 11.37m units, down 56.8% m/m and down 24.5% y/y, again against a strong February report last year.  As 5G data is still relatively short-term, it is hard to read much into the decline  but while 5G models remain about 50% of total new models in China, 5G shipments as a percentage of total Chinese smartphone shipments have fallen below the trend line for the last three months.  We doubt that pricing has much to do with the decline, as there is little premium attached to 5G models however given the weaker economic growth seen in China, we would expect a shift toward lower priced phones generally, which would be less likely to be 5G ready.
As is the norm, February is an odd month for CE products, especially in China given the February 1 New Year holiday, so we give it less weight than other months, while March tends to be more pivotal.  Typically March shipments in China are up 102.1% m/m, including last year’s 65.6% jump and the 2020 m/m increase of 240.8%, so we are expecting shipment to be a bit over 29m units in March, which will determine how we adjust our 2022 full year shipment estimate. 
Picture
China Smartphone Shipments & Y/Y ROC - 2019 - 2022 YTD - Source: SCMR LLC, CAIST
Picture
China 5G Smartphone Shipments & Share - Source: SCMR LLC, CAIST
Picture
China - 5G Smartphones - Share - Total Shipped & New Models - Source: SCMR LLC, CAIST
0 Comments

Mid-Range Smartphone Battle

3/23/2022

0 Comments


Mid-Range Smartphone Battle
​

With the first update for Apple’s mid-range price tiered iPhone SE in two years and Samsung’s announcement of its 2022 Galaxy A23 LTE the battle for mid-tier smartphone buyers has heated up quickly.  While the iPhone SE is out and the A23 is due this month, the faceoff between these two phones will be intense in coming months as they both offer a lower priced option to the flagship models from both brands.  Apple certainly has bragging rights as to the iPhone SE’s CPU, as it uses the same A15  (5nm)  chipset used in the iPhone 13 series, against Samsung’s use of Qualcomm’s (QCOM) Snapdragon 680 (6 nm), but it is still a bit early for processor benchmarking and more importantly actual use tests.  We note also that the iPhone SE is 5G ready (sub6 only), while the A23 LTE is not, while the A23 display is considerably larger and has more cameras, giving consumers a number of important tradeoffs to consider, along with the price.
Not all of the characteristic for the A23 have been revealed so the table below might change slightly, but we show the key features of both for comparison below:
Picture
0 Comments

Fun With Data – Apps

2/28/2022

0 Comments


Fun With Data – Apps
​

​We all spend a considerable amount of time on mobile devices each day and that amount of time seems to increase every year.  According to data from data.ai, Brazilians spend the most time on mobile devices at 5.4 average hours/day in 2021, up from 5.2hours/day in 2020 and 4.1 in 2019, with Indonesia 2nd and the US 10th, while China is a surprising 17th on the list and while Russia saw a big y/y boost in 2020, those increases slowed in 2021.  Putting China back in perspective, despite a continuing crackdown on a wide variety of applications, China has been the country downloading the most apps by a wide margin, for a number of years and in 2021 downloaded almost 4x the number of apps as did the next in line, India, despite the fact that both have similar population.  However when it comes to spending in App stores, while China remains first, the US is second, spending ~$43b to China’s ~$56.8b and Japan’s ~$20.7b, with India being out of the top 10 spenders list.
Further, when looking at data for which application categories were the most popular over the period between 2018 and 2021, it comes as no surprise that social media & communication (messaging) remains the primary application for mobile users, but has seen it share decline from 48.0% in 1Q 2018 to 41.9% in 4Q 2021, while the photos & video category (TikTok – ByteDance (pvt)) has increased from 19.0% in 1Q 2018 to 24.8% in 4Q 2021., while entertainment (movies, etc.) has remained between 2.0% and 3.2%, while game time has decreased during the period from 9.0% to 8.1%, surprising considering how much publicity the gaming sector generates.  On an overall basis, the number of hours spent in all app categories has grown from 615.18b hours in 1Q 2018 to 982.73b hours in 4Q 2021, or 59.7%, so while the world might be spending a bit less time on social media and a bit more time watching Tik Tok, the number of hours we spend on mobile devices continues to increase
Picture
Average Hours Spent On Mobile/Day & ROC By Country - Source: SCMR LLC, data.ai
Picture
App Downloads & ROC By Country - Source: SCMR LLC, data.ai
Picture
App Store Spending By Country - Source: SCMR LLC, data.ai
Picture
Hours Spent On Apps By Category - Source: SCMR LLC, data.ai
0 Comments
<<Previous
Forward>>

    Author

    We publish daily notes to clients.  We archive selected notes here, please contact us at: ​[email protected] for detail or subscription information.

    Archives

    May 2025
    April 2025
    March 2025
    February 2025
    January 2025
    January 2024
    November 2023
    October 2023
    September 2023
    August 2023
    June 2023
    May 2023
    February 2023
    January 2023
    December 2022
    November 2022
    October 2022
    September 2022
    August 2022
    July 2022
    June 2022
    May 2022
    April 2022
    March 2022
    February 2022
    January 2022
    December 2021
    November 2021
    October 2021
    September 2021
    August 2021
    July 2021
    June 2021
    May 2021
    April 2021
    March 2021
    February 2021
    January 2021
    December 2020
    October 2020
    July 2020
    May 2020
    November 2019
    April 2019
    January 2019
    January 2018
    August 2017
    July 2017
    June 2017
    May 2017
    April 2017
    March 2017
    February 2017
    January 2017
    November 2016
    October 2016
    September 2016

    Categories

    All
    5G
    8K
    Aapl
    AI
    AMZN
    AR
    ASML
    Audio
    AUO
    Autonomous Engineering
    Bixby
    Boe
    China Consumer Electronics
    China - Consumer Electronics
    Chinastar
    Chromebooks
    Components
    Connected Home
    Consumer Electronics General
    Consumer Electronics - General
    Corning
    COVID
    Crypto
    Deepfake
    Deepseek
    Display Panels
    DLB
    E-Ink
    E Paper
    E-paper
    Facebook
    Facial Recognition
    Foldables
    Foxconn
    Free Space Optical Communication
    Global Foundries
    GOOG
    Hacking
    Hannstar
    Headphones
    Hisense
    HKC
    Huawei
    Idemitsu Kosan
    Igzo
    Ink Jet Printing
    Innolux
    Japan Display
    JOLED
    LEDs
    Lg Display
    Lg Electronics
    LG Innotek
    LIDAR
    Matter
    Mediatek
    Meta
    Metaverse
    Micro LED
    Micro-LED
    Micro-OLED
    Mini LED
    Misc.
    MmWave
    Monitors
    Nanosys
    NFT
    Notebooks
    Oled
    OpenAI
    QCOM
    QD/OLED
    Quantum Dots
    RFID
    Robotics
    Royole
    Samsung
    Samsung Display
    Samsung Electronics
    Sanan
    Semiconductors
    Sensors
    Sharp
    Shipping
    Smartphones
    Smart Stuff
    SNE
    Software
    Tariffs
    TCL
    Thaad
    Tianma
    TikTok
    TSM
    TV
    Universal Display
    Visionox
    VR
    Wearables
    Xiaomi

    RSS Feed

Site powered by Weebly. Managed by Bluehost