Samsung Electronics DS Division Analysis: The HBM4 Yield Paradox and 2026 Profitability Leverage
Typically when a large CE company reports a significant quarter we detail the results and comment on the believability of the company’s comments. In the case of Samsung’s 4Q 2025 results, we look more toward the factors that are driving the company’s performance and how they are the same or different from other cycles. We believe this has more value than reporting results in this particular quarter.
Samsung Electronics (005930.KS) is among the largest consumer electronics companies in the world, behind only Amazon (AMZN) and Apple (AAPL) in terms of sales and is therefore of great interest to those who compete in the space. The company’s diversity in the CE product world helps it to maintain this position as the broad CE market moves through various product cycles that favor a particular Samsung division or product portfolio. Over the years the four Samsung divisions have powered the company’s sales and profitability, although the company’s consumer facing businesses (DX Division) typically generate the highest revenue share, as shown in the table below and in Figure 1 .
Divisional Revenue Share (2022-2025): The Strategic Balance Between DX (Device Experience) and DS (Device Solutions)

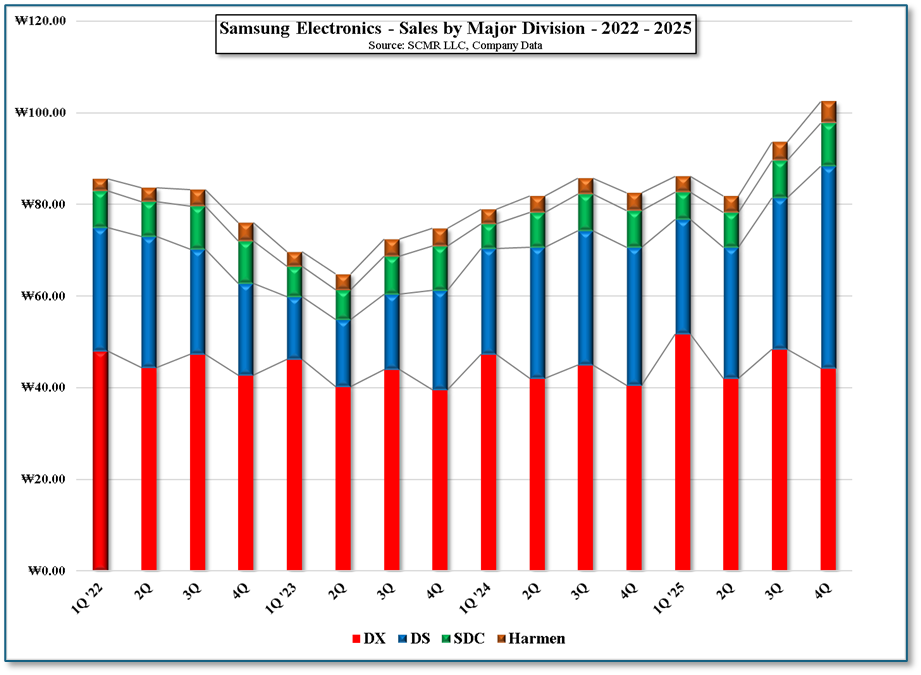
Figure 1 - Samsung Electronics - Sales By Major Division - 2022 - 2025 - Source: SCMR-LLC, Company Data
That said, the four divisions can be broken down into more defined segments or sub-groups as shown below and in Figure 2, Figure 3, Figure 4, and Figure 5[1], which points to the importance of the mobile device sub-segment (MX) as the revenue driver for the DX division and the memory sub-segment as the driver for the DS division.
Samsung Electronics – Divisional Breakdown (Leading share positions in RED)
[1] Note: We use the same Y scale on all four charts to point out their relative contribution to sales
Samsung Electronics – Divisional Breakdown (Leading share positions in RED)
- DX – Device Experience – Consumer Facing
- MX – Mobile Experience – Galaxy Smartphones, Watches, Earbuds, Laptops
- VD – Visual Display – TVs, Sound Bars, Monitors, Micro-LED Displays, Digital Signage (BTB)
- DA – Digital Appliances – Refrigerators, Washer/Dryers, Air Conditioners, Vacuum Cleaners, Ovens
- Networks – 5G/6G infrastructure equipment
- DS – Device Solutions - Manufacturing
- Memory – DRAM, NAND, HBM
- System LSI – Mobile processors, Optical sensors, Power management ICs. Automotive silicon
- Foundry – Contract Chip manufacturing
- SDC – Samsung Display – Small/medium OLED displays, QD/OLED monitor & TV panels
- Harman – Automotive cockpits, car audio systems, autonomous sensors, Consumer audio (JBL, AKG, Harman Kardon, etc.), Professional (BTB) lighting & Audio
[1] Note: We use the same Y scale on all four charts to point out their relative contribution to sales
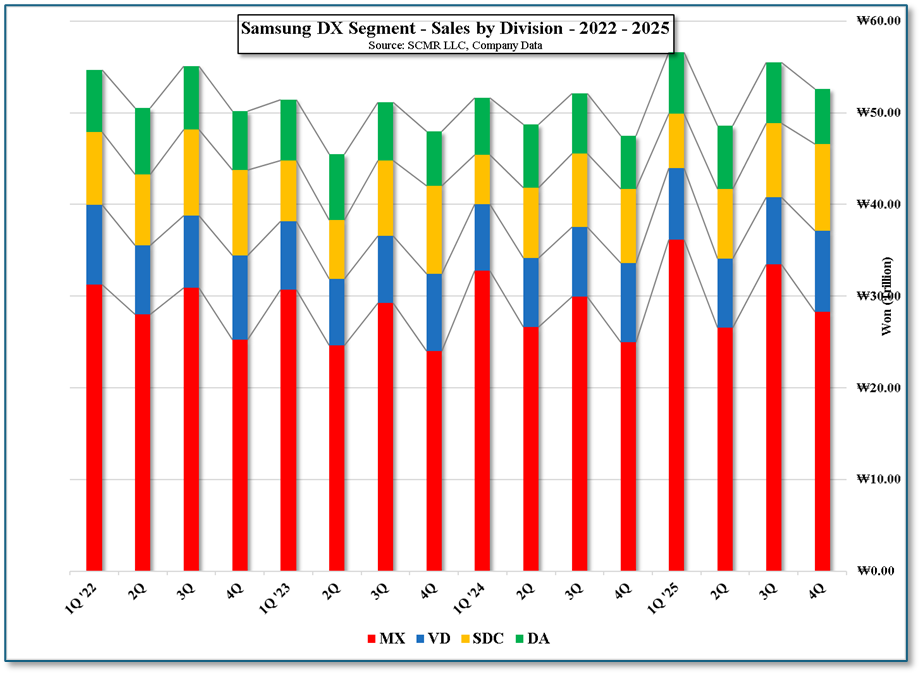
Figure 2 - Samsung DX Segment - Sales By Division - 2022 - 2025 - Source: SCMR-LLC, Company Data
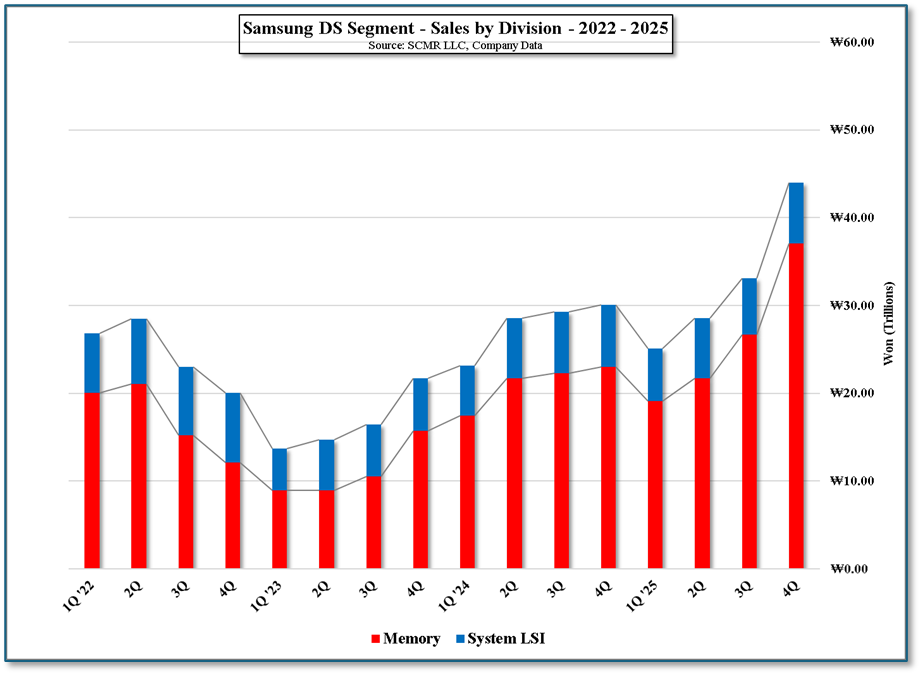
Figure 3 - Samsung DS Segment - Sales By Division - 2022 - 2025 - Source: SCMR-LLC, Company Data
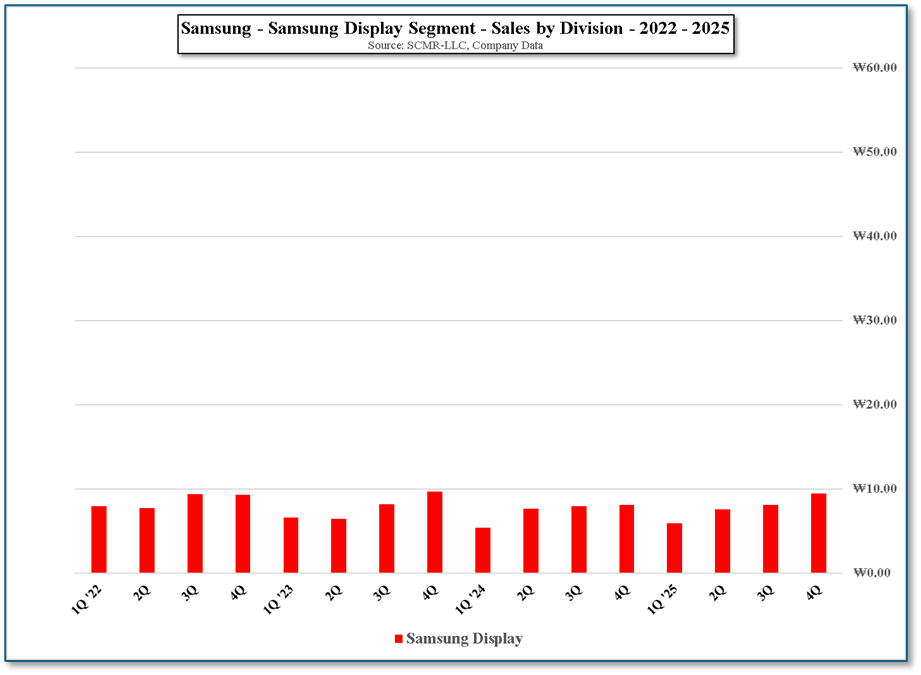
Figure 4 - Samsung – Samsung Display Segment - Sales By Division - 2022 - 2025 - Source: SCMR-LLC, Company Data
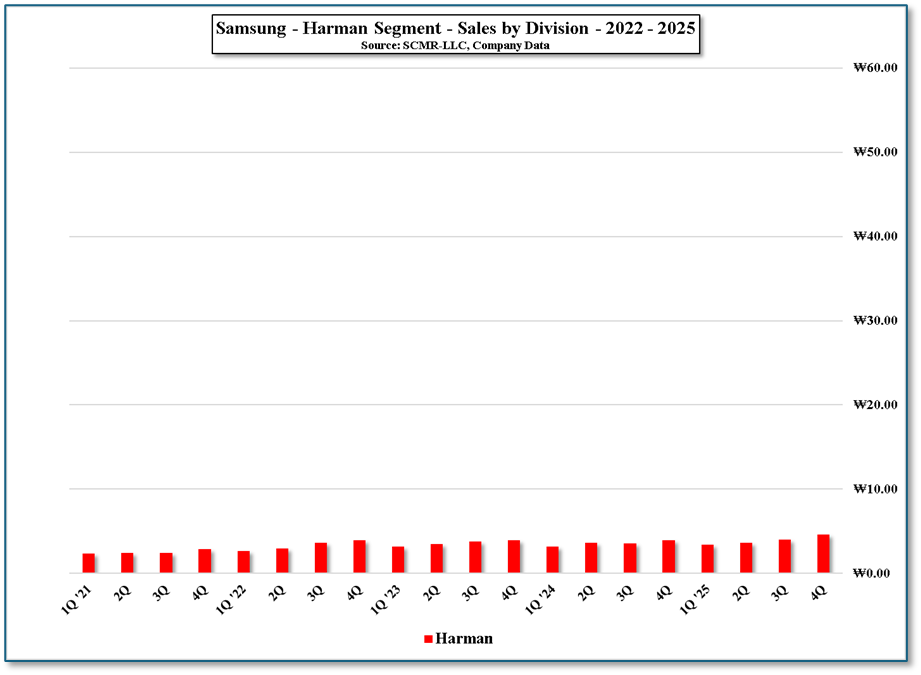
Figure 5 - Samsung Harman Segment - Sales By Division - 2022 - 2025 - Source: SCMR-LLC, Company Data
Operating Profit & Fixed Costs Analysis
Understanding Samsung’s Divisional Operating Profit takes a bit more detail, particularly in 2Q 2023 when the company generated only ₩0.07 trillion or $524 million US in sales, essentially barely breaking even on an operating profit basis. With fixed costs estimated to be between 60% and 70% of sales, the ~₩60 trillion ($47.2 billion US) in sales generated an operating margin of only 1.1%. This made averaging quarterly share of operating profit into a yearly average almost impossible, so rather than show an outlier for yearly operating profit, (2023) we show the data in table form below.
Understanding Samsung’s Divisional Operating Profit takes a bit more detail, particularly in 2Q 2023 when the company generated only ₩0.07 trillion or $524 million US in sales, essentially barely breaking even on an operating profit basis. With fixed costs estimated to be between 60% and 70% of sales, the ~₩60 trillion ($47.2 billion US) in sales generated an operating margin of only 1.1%. This made averaging quarterly share of operating profit into a yearly average almost impossible, so rather than show an outlier for yearly operating profit, (2023) we show the data in table form below.
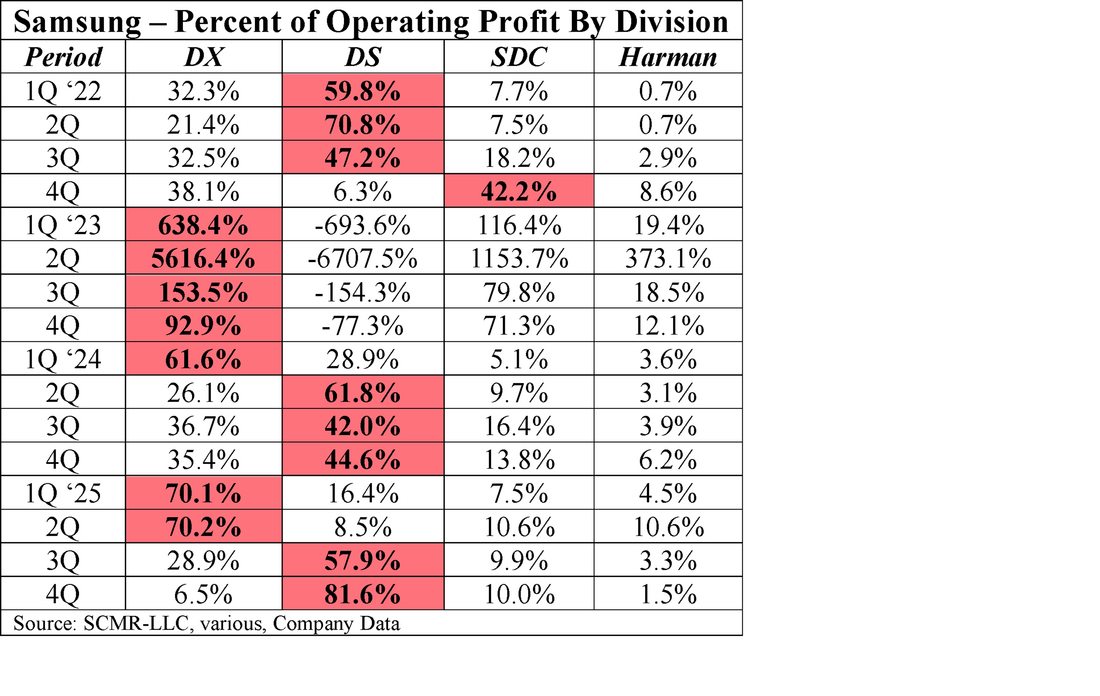
Based on this data it can be seen that Samsung’s DS division (Memory is between 60% and 76% of sales) has been the primary operating profit division for 8 the last 16 quarters, with the DX (smartphones and TVs) the op profit leader in 7 of 16 (Display was the leader in I quarter, primarily because both phones and memory were weak). However in order to understand the DS division’s profitability leverage, we look at the profitability levels against a consensus DRAM ASP/GB.

Based on this data it would seem that Samsung’s DS division would need a DRAM ASP of ~$0.30 to maintain profitability, with the data showing that every time DRAM ASP fell below $0.30 Samsung was not able to cover fixed costs for the DS division. With the current average price of DRAM at $1.05, it would seem that it would take a ~70% drop in the price of DRAM for the DS division to fall to break-even.
In fact, that is not the case, as if we look at operating profit efficiency for the DS division. The division contains Samsung’s foundry and the System LSI businesses which we believe would lower the divisional operating profit, making memory look even more profitable, but we believe that there are other factors that drive the division’s operating profit.
In 2023 Samsung faced a two-fold problem. DRAM prices were falling below the assumed $0.30 average price for break even and, at the same time, in order to try to slow that price decline, the industry lowered its utilization rate, raising the cost per chip. Currently Samsung is in the opposite position. High DRAM prices and high utilization which
Fab Utilization (Generalized)
- 75% - Fixed costs are a burden – Without high memory prices losses occur
- 80% - Roughly break even
- 85% - Profitable
- 90% - More profitable
- 95% - Every $0.01 of memory price increase generates $0.85 in profit

High Bandwidth Memory (HBM) Manufacturing: The Silicon Area and Bit Density Trade-off
High Bandwidth memory production differs from standard memory production such as DDR4 or DDR5 in a number of ways.
Risk Factors for 2026: HBM4 16-Layer Stacking Yields and DX Division Demand Pressures
HBM3 is a 12 layer product while HBM4 is a 16 layer product. This means that if one die in the stack is faulty Samsung tosses 16 die rather than 12, which keeps initial yields low (10% - 15%). If Samsung is unable to improve yield to 50% they will be scrapping 33% more finished silicon.
If Samsung (and other memory producers push prices too high, it will affect Samsung’s DX (mobile and TV) divisions by reducing demand. This issue already weighed on the DX division in 4Q (10% profit decrease), with forecasts of between 2% and 5% decrease for DX in 2026, any further slowdown, while it will push the profitability of the DS division higher, it will increase the negative effect on Samsung’s other businesses.
Summary & Conclusion: The HBM Efficiency Paradox and Samsung’s 2026 Outlook
Samsung Electronics enters 2026 in a state of high-stakes transition. While the company maintains its global dominance through a diversified portfolio across the DX and DS divisions, its financial health remains disproportionately tethered to the cyclical volatility of the memory market.
The Convergence of Pricing and Utilization
The historical data from 2022 to 2025 illustrates a clear "survival line" for the DS division at a DRAM ASP of ~$0.30/Gb. Below this threshold, as seen in the brutal 2023 downturn, the division’s heavy fixed costs (60-70% of sales) become an insurmountable burden, particularly when coupled with lower utilization rates. Conversely, the current environment of $1.05 ASP provides a massive 70% buffer above break-even, allowing the DS division to reclaim its role as the company’s primary profit engine, contributing 81.6% of total operating profit in 4Q 2025.
The Efficiency Index: HBM as the Variable
Perhaps the most critical insight from this analysis is the Efficiency Index. The fact that 4Q 2025 efficiency (15.62) remains lower than the 2Q 2022 peak (20.00)—despite prices being more than double—highlights the "HBM Tax." The move to High Bandwidth Memory has fundamentally altered the DS division’s cost structure:
Looking ahead, Samsung’s path to maximizing operating profit rests on a delicate three-way balance:
Key Indicators for 2026 Performance:
High Bandwidth memory production differs from standard memory production such as DDR4 or DDR5 in a number of ways.
- Area – The comparison here is about silicon. Standard memory wafers are designed to do cover almost the entire surface with storage while HBMs are multi-level, with thousands of TSVs (Through Silicon Vias) that connect various points on each level. These TSVs take up space that would typically be used for storage which means that an HBM will be roughly twice the size of a DDR die for the same storage capacity. This means that the lithography tool moving across the wafer at a fixed rate and coverage size takes longer to process the extra area, as will the metrology tools used to inspect the detail
- Bit Density – As HBM’s require much room for TSVs and a wider data path, they are less dense (~16Gb/nm2)than standard DRAM (~30Gb/nm2) (DDR5 for example), which means more surface area is needed to reach an equivalent capacity.
- Units/wafer – When accounting for the lower HBM density and larger area, the comparison for a 12” wafer is roughly 1,000 DDR5 chips against 450 to 500 HBM3E chips, but when you account for the larger die size plus the fact that you have to stack 8 or 12 of them to make one finished product, one HBM stack consumes roughly 3 to 4 times more wafer starts than an equivalent amount of DDR5.
Risk Factors for 2026: HBM4 16-Layer Stacking Yields and DX Division Demand Pressures
HBM3 is a 12 layer product while HBM4 is a 16 layer product. This means that if one die in the stack is faulty Samsung tosses 16 die rather than 12, which keeps initial yields low (10% - 15%). If Samsung is unable to improve yield to 50% they will be scrapping 33% more finished silicon.
If Samsung (and other memory producers push prices too high, it will affect Samsung’s DX (mobile and TV) divisions by reducing demand. This issue already weighed on the DX division in 4Q (10% profit decrease), with forecasts of between 2% and 5% decrease for DX in 2026, any further slowdown, while it will push the profitability of the DS division higher, it will increase the negative effect on Samsung’s other businesses.
Summary & Conclusion: The HBM Efficiency Paradox and Samsung’s 2026 Outlook
Samsung Electronics enters 2026 in a state of high-stakes transition. While the company maintains its global dominance through a diversified portfolio across the DX and DS divisions, its financial health remains disproportionately tethered to the cyclical volatility of the memory market.
The Convergence of Pricing and Utilization
The historical data from 2022 to 2025 illustrates a clear "survival line" for the DS division at a DRAM ASP of ~$0.30/Gb. Below this threshold, as seen in the brutal 2023 downturn, the division’s heavy fixed costs (60-70% of sales) become an insurmountable burden, particularly when coupled with lower utilization rates. Conversely, the current environment of $1.05 ASP provides a massive 70% buffer above break-even, allowing the DS division to reclaim its role as the company’s primary profit engine, contributing 81.6% of total operating profit in 4Q 2025.
The Efficiency Index: HBM as the Variable
Perhaps the most critical insight from this analysis is the Efficiency Index. The fact that 4Q 2025 efficiency (15.62) remains lower than the 2Q 2022 peak (20.00)—despite prices being more than double—highlights the "HBM Tax." The move to High Bandwidth Memory has fundamentally altered the DS division’s cost structure:
- The Complexity Penalty: With HBM consuming 3 to 4 times more wafer starts and doubling cycle times to 20 weeks, Samsung is effectively "trading" volume for value.
- The Yield Hurdle: The transition to 16-layer HBM4 introduces a significant risk. If yields do not improve from their initial low levels (10-15%), the resulting scrap rate could stifle the very efficiency gains Samsung expects from higher pricing.
Looking ahead, Samsung’s path to maximizing operating profit rests on a delicate three-way balance:
- Manufacturing Execution: Successfully scaling HBM4 yields toward 50% and beyond to offset the massive silicon consumption of 16-layer stacks.
- Foundry Normalization: Leveraging major contracts, such as the $16.5 billion Tesla deal, to increase utilization and mitigate the "Foundry drag" that has historically weighed on DS margins.
- Intra-Company Harmony: Managing the pricing "see-saw" where high memory profits do not inadvertently cripple the DX division's demand by making Galaxy devices and Visual Display products too expensive for a softening consumer market.
Key Indicators for 2026 Performance:
- HBM4 Yield Rate: The most critical variable. Success depends on moving from the current ~15% "initial phase" to a stable >50% by Q3.
- Foundry Utilization: Keep an eye on the Taylor, Texas fab. With the $16.5 billion Tesla contract, hitting an 80% utilization rate would effectively "stop the bleed" from the Foundry unit.
- DRAM ASP Stability: While current prices are at $1.25/Gb (a 50% increase over late 2025), any rapid correction toward the $0.30 "fixed-cost floor" would necessitate immediate production cuts.
 RSS Feed