Supply Chain Market Research - SCMR LLC
  • Blog
  • Home
  • About us
  • Contact

OLED TV Update

8/24/2021

0 Comments


OLED TV Update
​

The TV business has been a difficult one this year, with a weak Chinese market leaving growth to come from North America and Europe.  However as lockdowns are reduced the necessity for TV has diminished and coupled with rising prices has left the TV space with little to get enthusiastic about.  Large panel producers have been moving production to more profitable large panel products such as monitors and notebooks and while this would typically tighten the market and sustain panel prices, as we noted yesterday, TV panel prices have begun to fall.  While this is good for set manufacturers, potentially alleviating some of the cost escalation they have seen over the past year, we are less enamored of the generic TV space this year, while more open to growth in the OLED TV space, where panel production is limited to one supplier and is therefore a bit less prone to the competitive nature of the display business.
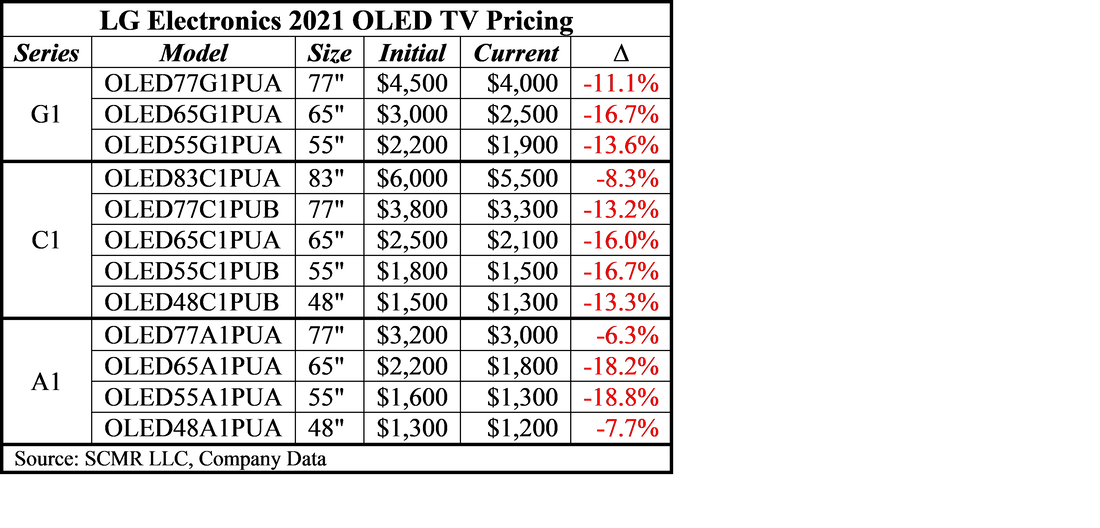
There are many good points relative to large panel OLED displays, and a number of issues, but from the standpoint of overall picture quality, they are still considered the pinnacle of TV commercial technology.  OLED TVs are more expensive than their LCD brethren, and do face direct and indirect competition from quantum dots and mini-LED technologies, but at least for now, we look at OLED TVs as Wagyu beef against the skirt steak of most LCD TVs.  As LG Display (LPL) is the supplier of almost all large panel OLED displays and LG Electronics (066570.KS) is the premier OLED brand, we look at the company’s current line of OLED TVs, which were announced in late March to see how pricing has changed so far this year.
While there are many LG OLED TVs available on Amazon (AMZN) and sites like Best Buy (BBY) or Costco (COST), we are only looking at the current year’s models, all of which will have a model format that looks like this: 
Picture
Therefore all 2021 models will be either G1, C1, or A1, so when hunting through sites for an OLED TV bargain, remember to check the year code to make sure you are getting this year’s models.  Pricing for such sets is usually highest on release, although pre-order deals can make a significant impact on initial set prices, but on a general basis, it is usually best to wait at least 3 – 4 months before buying new models, as prices tend to decline during the summer months.  
 As noted, because LG Display is essentially the only producer of OLED TV panels, OLED TV panel pricing sees far less price competition than with LCD TV panels, however over the last few years, as LG Display increased production and consumers became familiar with OLED TVs, there has been a bit more sensitivity toward set and panel pricing., more a result of improvements in LCD technology rather than direct OLED TV competition.   LG Display has also made improvements in its production methodology and built out capacity at its Guangzhou, China OLED fab, which has helped them to lower costs.  How much of that savings gets passed on to customers remains within LGD, but OLED TV set prices have certainly declined over the last few years as the number of sizes increases (both smaller and larger).
LG Display, likely at the request of LGE, introduced 48” OLED TVs last year, creating a lower price point that has attracted consumers by lowering the OLED TV entry bar to ~$1,200, with short-term discounts by some retailers bringing the price down to just under $1,000, with 48” 4K TVs ranging in price from ~$1,200 to as low as $332 for comparison.  This has caused gamers to look at 4K OLED TVs as potential oversized monitors, with LG promising to release an even smaller (42”) OLED TV specially designed for gamers later this year.  However it looks like LG has postponed that release until 2022 to avoid it getting lost among sets being released for the 2021 holidays and is now expected to preview the new size at CES next January.  LG already includes a few features that gamers desire, such as 120 Hz refresh rate, Dolby (DLB) Vision Gaming, but will add direct support for gaming consoles to the 42” model.
Picture
​With weaker TV panel prices expected in 2H, OLED TVs will have a tougher time competing against LCD and its variants, but we expect there could be a very different OLED TV market developing in 2022 and 2023.  If Samsung Display (pvt) is successful in developing a process for producing RGB OLED TVs (see our note 8/2/21, 8/16/21), LG Display could face significant competition and price pressure.  While we expect costs for even this new OLED process to be high at the onset, just the fact that there will be a new large panel OLED producer will change the OLED TV market, with consumers likely seeing lower priced product.  Much will depend on Samsung Display’s process and whether they are able to solve the myriad of potential problems that arise when moving from pilot lines to mass production lines, but we expect consumers will benefit.
0 Comments

Loose Lips

8/24/2021

0 Comments


Loose Lips
​

​Samsung Electronics (005930.KS) is a bit sensitive about its semiconductor IP and process technology and its suppliers are getting a taste of what that can mean if somethings leaks out.  It seems that Samsung has sent a new confidentiality agreement to a number of its component suppliers last month that outlined stricter security measures concerning its more ‘delicate’ technology and potential fines (>$85,000 for each violation).  While there were two ‘levels’ of contracts, the more stringent went as far as asking partners to notify Samsung if an employee leaves the supplier and winds up working for a Samsung competitor within a year.  While this is something usually reserved for Samsung employees, the company is looking to track partner employees if they leave after working on a sensitive Samsung project, and is also asking that partner employees that previously worked for a Samsung competitor be excluded from sensitive Samsung projects.
While these requests might seem a bit overbearing, they are based in a healthy paranoia that Samsung developed after it was discovered that SK Hynix (000660.KS), the 3rd largest semiconductor foundry, discovered that its wafer cleaning tool supplier Mujin Electronics (pvt), from whom it had bought between 350 and 400 such tools, had decided to sell that same tool, which had been developed in conjunction with Samsung Electr0-Mechanics (009150.KS), to a Chinese semiconductor competitor, Changxin Memory Technologies (pvt), which did not sit well with SK Hynix or the Korean courts who jailed the Mujian executives that made the sale.   
SK Hynix was forced to ask other suppliers to develop wafer cleaning tools to replace Mujian, but was forced to continue to buy from Mujian given the long development time for alternative suppliers.  Samsung, SK Hynix’s major competitor, forced Hynix to remain with the vendor who sold their co-developed technology to a competitor, withholding the SEMES tool after the leak, and also ended its distribution contract with Mujian (see our 01-29-21 note for details). 
This obviously made an impact on Samsung, who ended its who seems to be reminding its suppliers that proprietary technology is exactly that, and risking a lucrative contract with the 2nd largest semiconductor foundry by allowing an employee to leak information to a competitor is a big mistake.  While we expect competitors would pay premium prices for a tool that would give them an edge over Samsung, the cost of that sale would likely be far more than a fine of $85,000 and its discovery would end its contract with Samsung.  Perhaps the new confidentiality agreements are a bit over the top, but it is easy to see that Samsung’s concerns are real and that suppliers either comply or risk losing what could be their largest customer.
0 Comments

Apple Mini-LED Supply Chain Update

8/23/2021

0 Comments


Apple Mini-LED Supply Chain Update
​

While we expect Apple (AAPL) will modify and expand its Mini-LED supply chain as the company adds additional Mini-LED product conversions to its line later this year, we can garner at least a rough map of current players.  These suppliers are certainly not exclusive, at least intentionally so, as Apple is wary of single-point-of-failure issues, but in these relatively early days of Mini-LED production, not all suppliers can meet Apple’s technology, quality, and volume demands, especially after issues around some of Apple’s earlier Mini-LED products gave users cause for questioning whether the change to Mini-LED is a good one.  With iPad sales strong, it seems the overall Apple customer is convinced, but we would imagine Apple is particularly careful when adding new suppliers.  Here’s the latest list.
Picture
0 Comments

LCD Large Panel Shipments – July Final

8/23/2021

0 Comments


LCD Large Panel Shipments – July Final
​

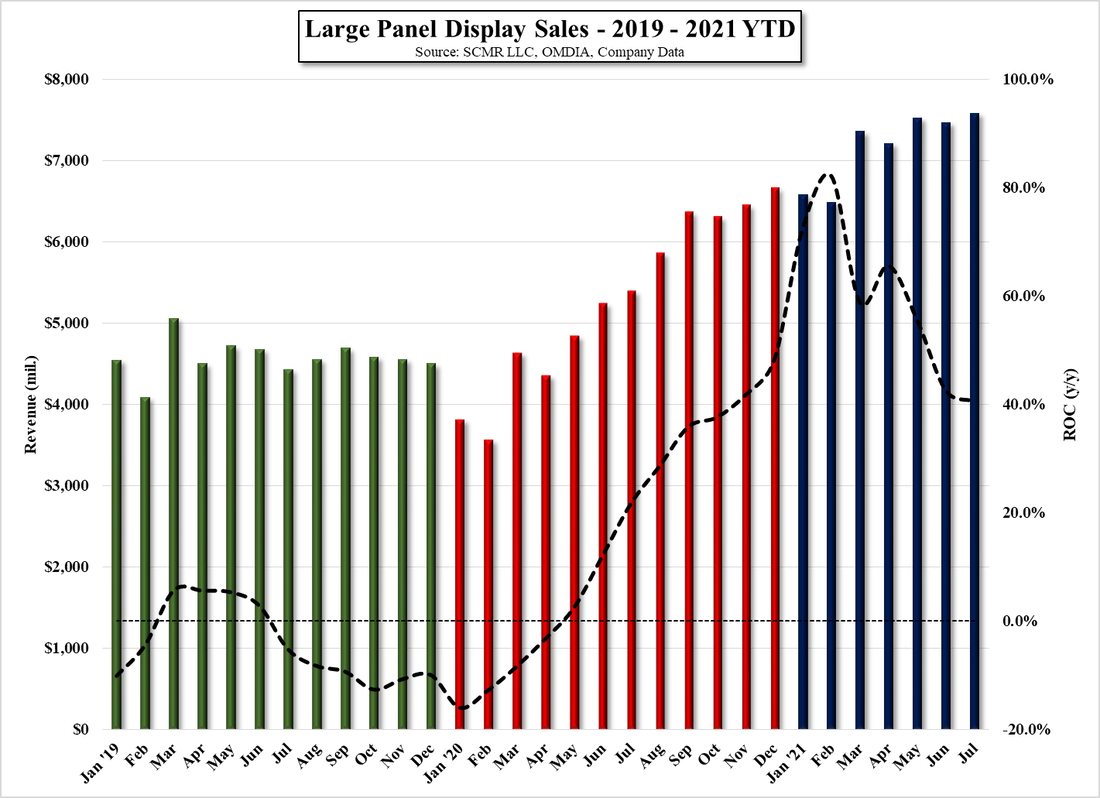
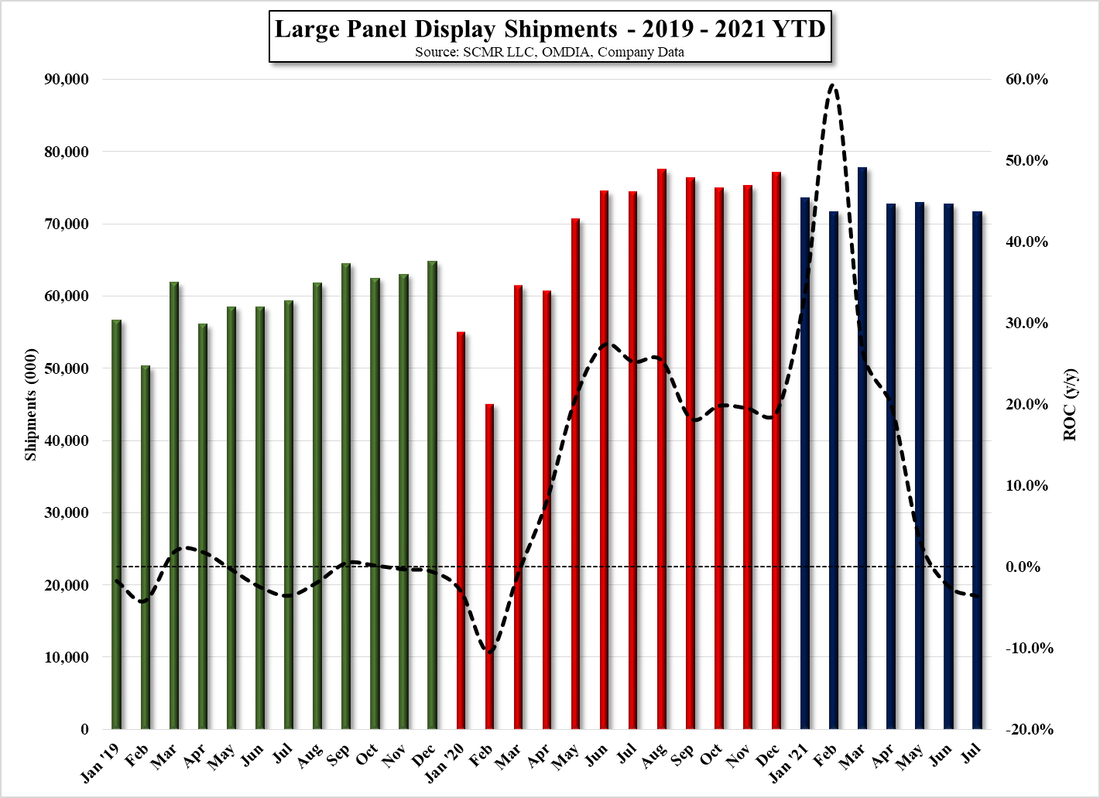
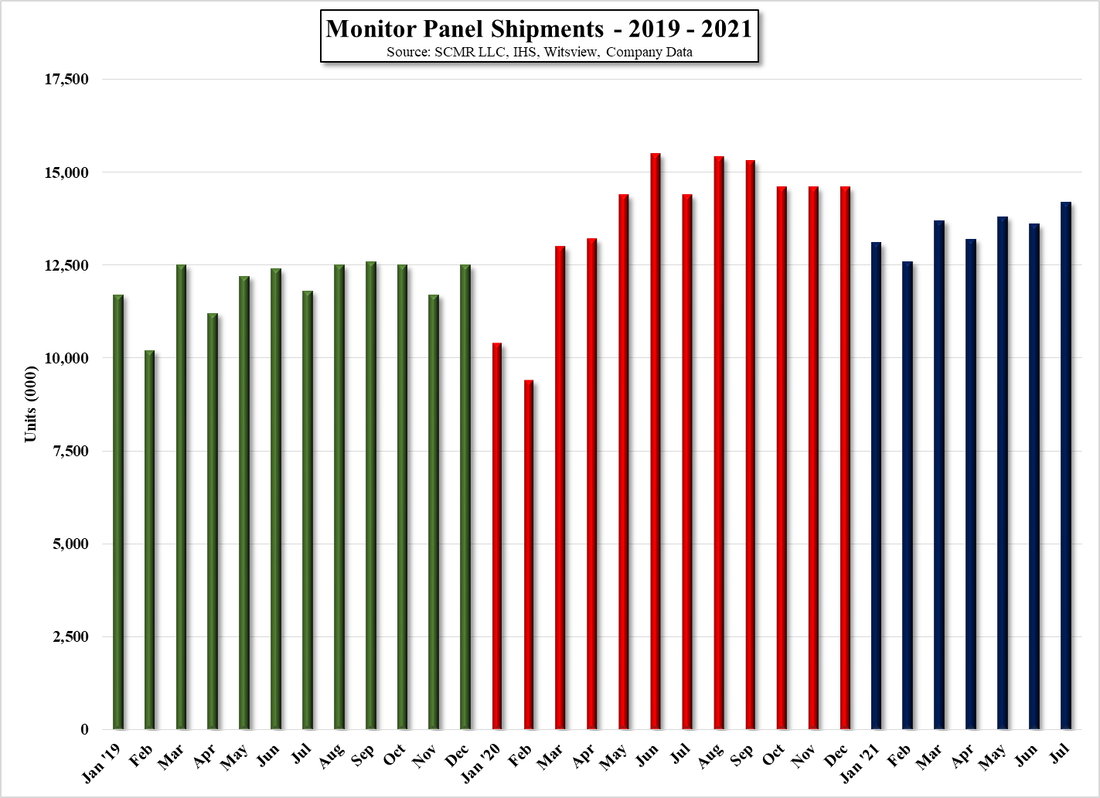
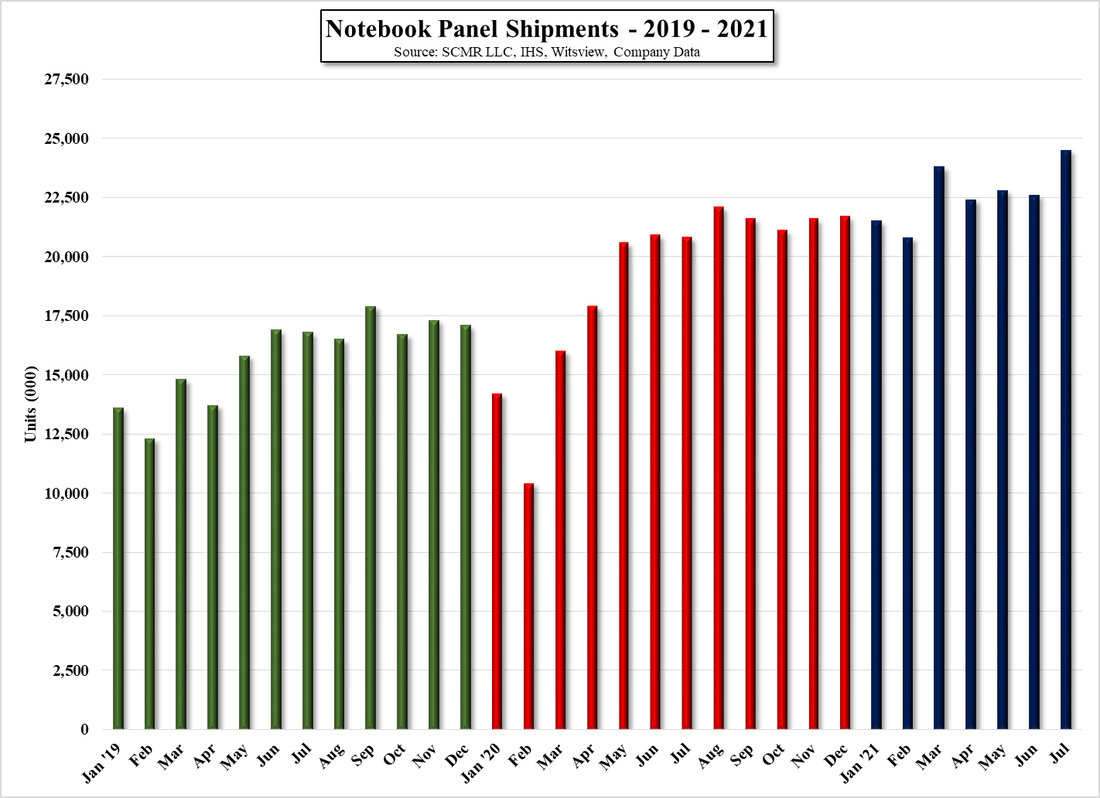
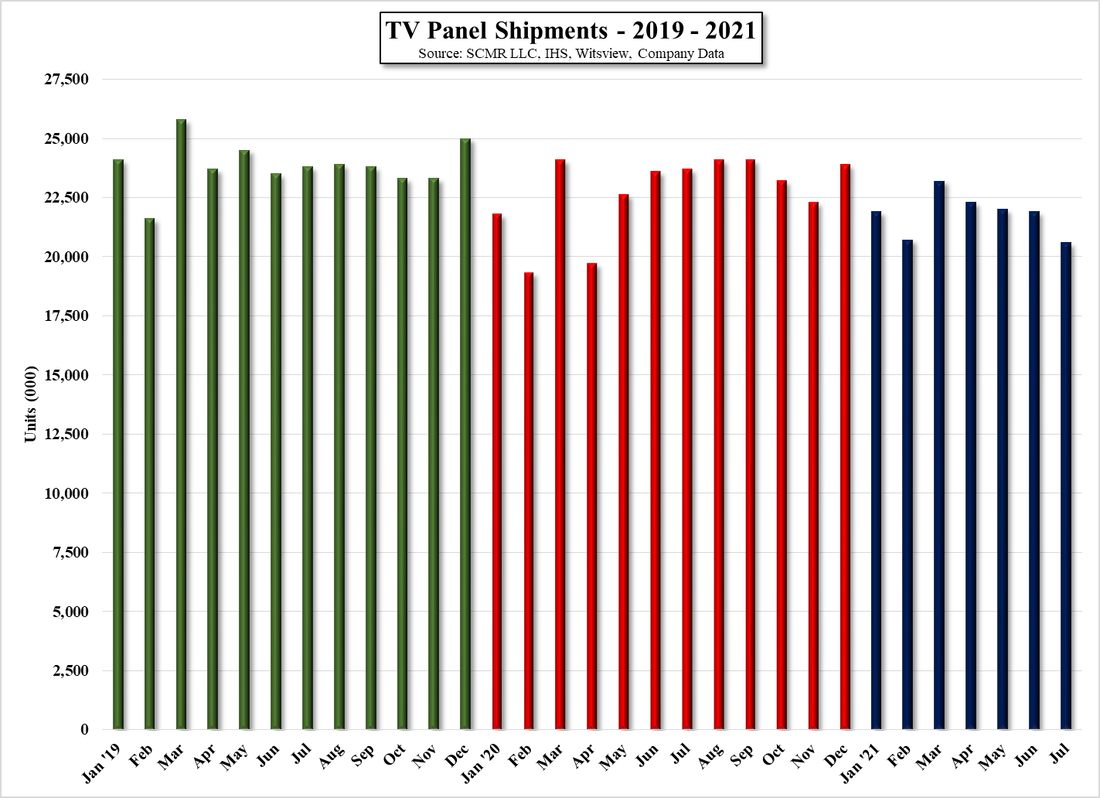
After seeing August results for panel prices above, the fact that large panel sales increased in July by 1.5% seems a bit unspectacular.  While we would expect the impact of the August drop in large panel prices to be felt the greatest in China, as it has been averaging 48.7% of industry large panel sales, both Taiwan (26.5% avg.) and South Korea (19.7%) will also feel some of the effects, and any slowdown in shipments of panel prices for monitors and notebooks will exacerbate the impact.  July saw overall large panel shipments down 1.4% m/m but was offset by a 2.9% increase in ASP (m/m) which is a bit off from typical July shipments, which average (5 year) +1.0%.  August is typically a stronger month, averaging +4.8% in m/m shipments and a 5.6% increase in large panel sales, but the impact of the TV panel price drop will impact overall industry sales, regardless of shipments, unless there is some anomaly that pushes shipments out of normal range for August.  As July is a ‘rear-view mirror’ month, given what we know about August, the charts below will tell the story.
Picture
Large Panel Display Sales - 2019 - 2021 YTYD - Source: SCMR LLC, OMDIA, Company Data
Picture
Large Panel Display Shipments - 2019 - 2021 YTD - Source: SCMR LLC, OMDIA, Company Data
Picture
Monitor Panel Shipments - 2019 - 2021 YTD - Source: SCMR LLC, IHS, Witsview, Company Data
Picture
Notebook Panel Shipments - 2019 - 2021 YTD - Source: SCMR LLC, IHS, Witsview, Company Data
Picture
TV Panel Shipments - 2019 - 2021 YTD - Source: SCMR LLC, IHS, Witsview, Company Data
0 Comments

Panel Prices – “Elevator Out of Service”

8/23/2021

0 Comments


Panel Prices – “Elevator Out of Service”
​

LCD panel prices, particularly TV panel prices, have been on the rise since last May.  During June and July there were rumblings that demand was slowing a bit and perhaps 3Q would not see the rapid price increases that had been seen in previous months.  Some of this ‘cautionary talk’ cited component shortages, double ordering, and COVID-19 outbreaks as the root cause, but as we said in our 08/06/21 note, the rest of the industry nodded quietly during such discussions but indicates that those factors have not affected their business and expectations remain unchanged. 
Our expectations for August were for relatively modest increases in IT product panel prices (Monitors & Notebooks), while TV panel prices were a bit more bifurcated, with the most price pressure on smaller TV panels, while demand for larger TV panels was a bit better and could see some increases, although the aggregate was down.  We did note that panel producers have been shifting capacity away from TV panel production toward IT products, the leverage toward production of those panels has certainly been favorable for LCD panel producers, but at some point that leverage will work against panel producers should demand slow in that segment, more a matter of ‘when’ than ‘if’.
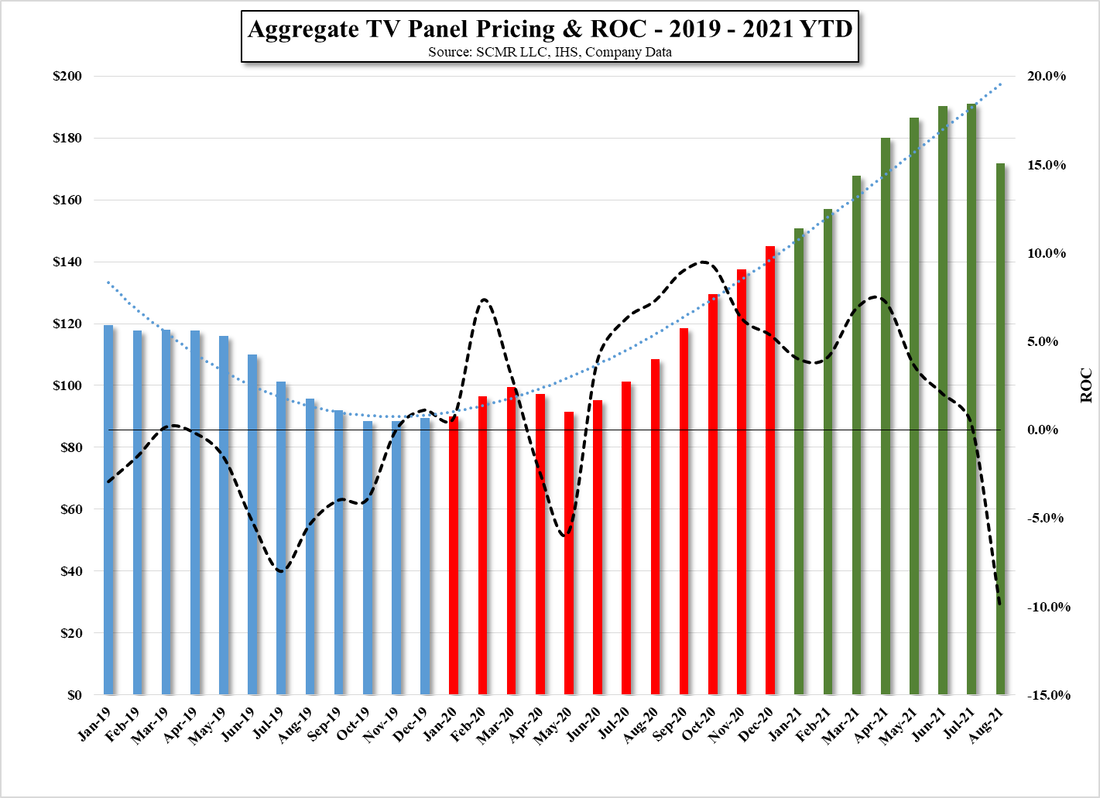
That was not the case in August for IT products, panel prices rose again, but it was the case for TV panels who saw the first aggregate TV panel price drop since May 2020, with prices down 10.1%.  It is difficult to pinpoint which of the potential factors caused the greatest impact to TV panel prices, but we expect all of the contributing factors that we have mentioned in the past, including component shortages, higher logistics costs, and the realization that higher overall TV set prices would stifle consumer demand, finally became reality for TV set producers and their expectations for 3Q and the holiday season began to wither on the vine.  In the case of TV panel prices, the withering was not just for smaller TV panel sizes but across the board and far greater than even our modestly pessimistic view had expected.
Picture
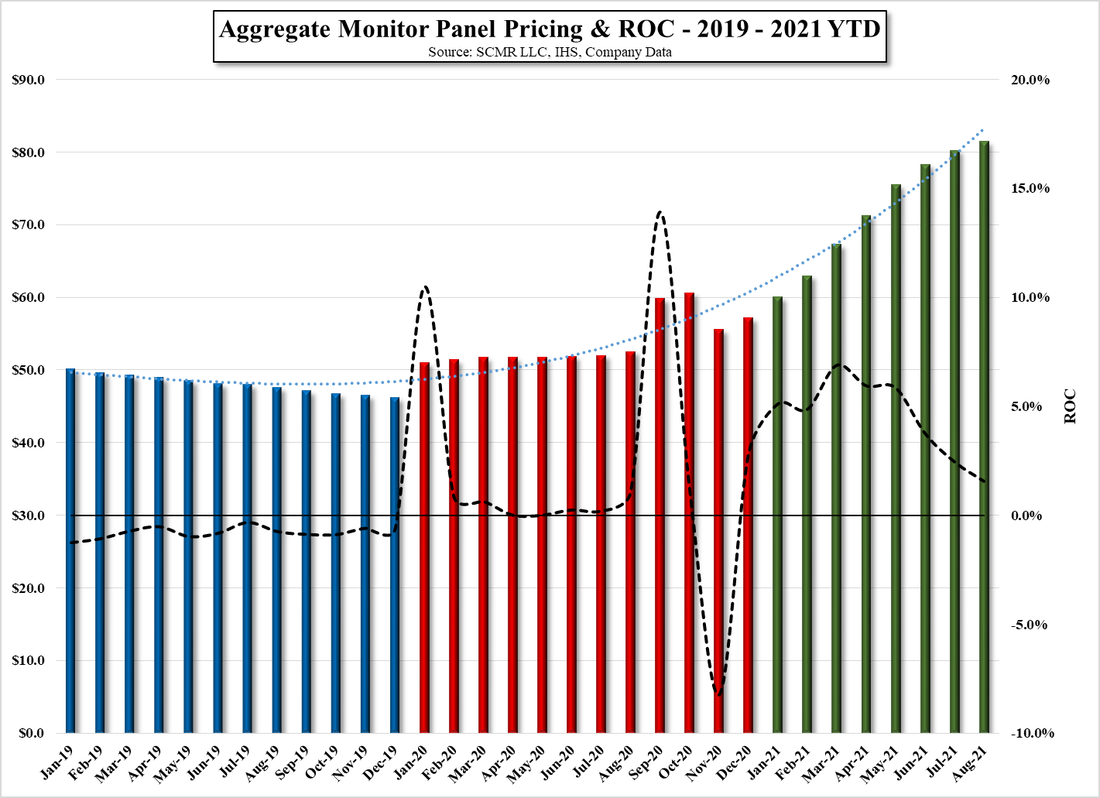
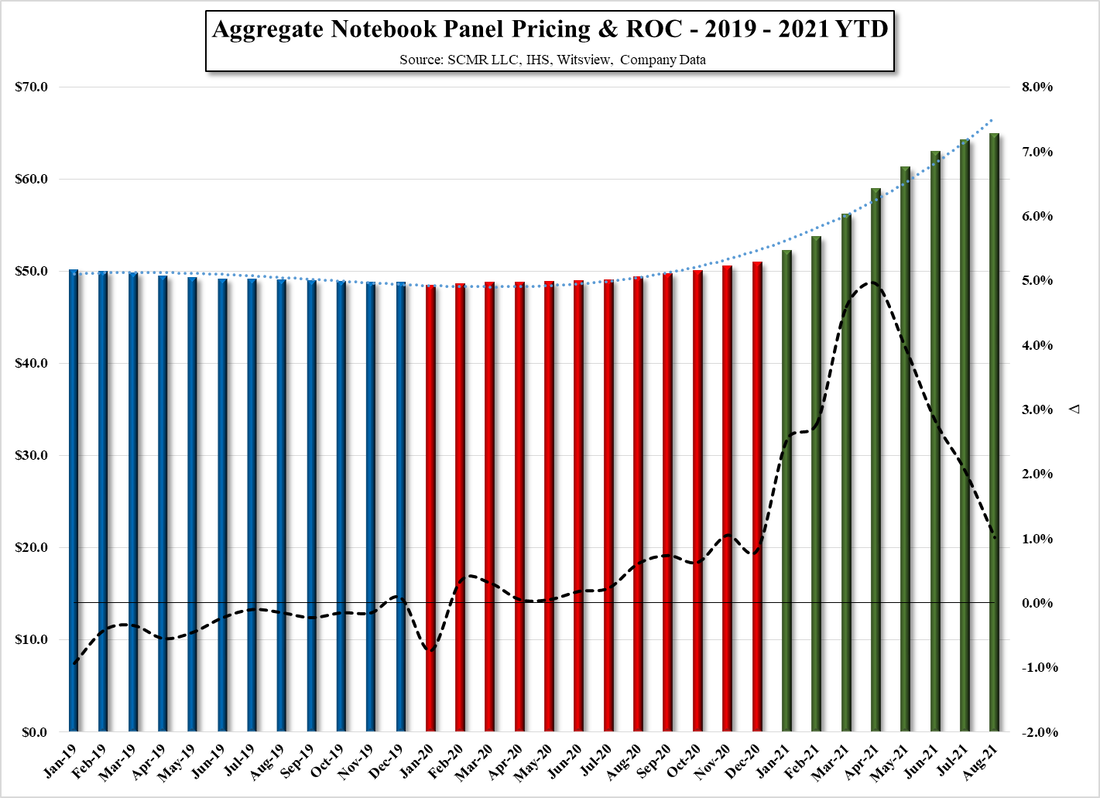
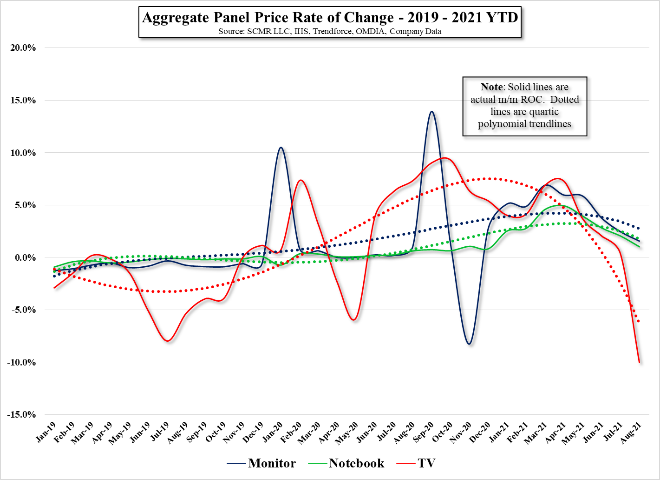
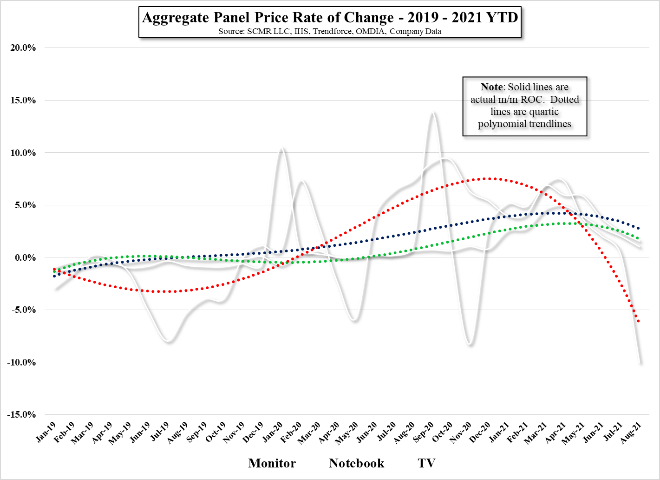
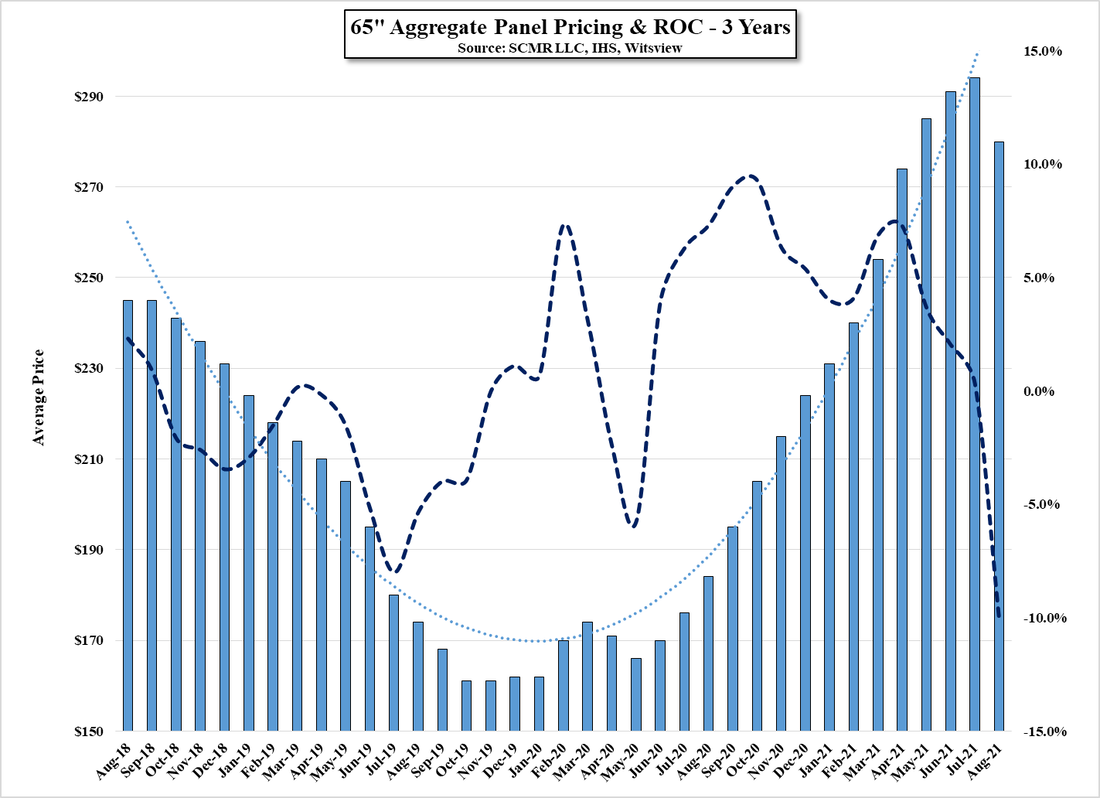
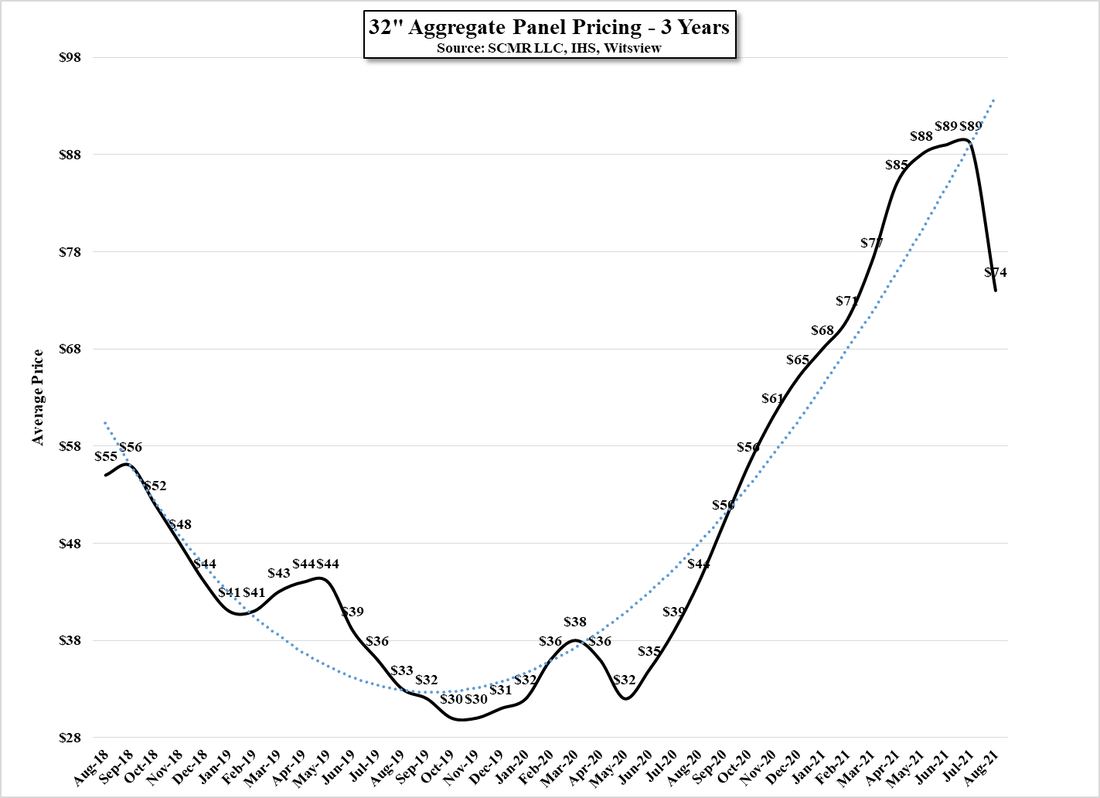
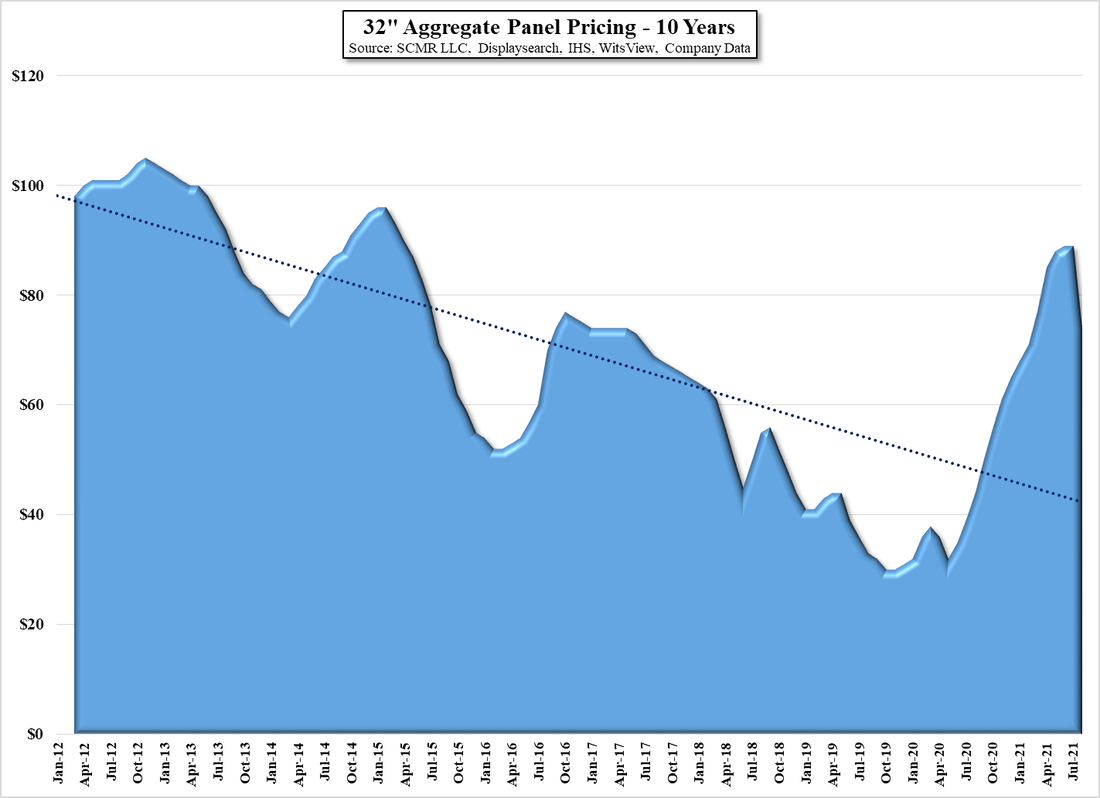
Figs. 1 – 3 show aggregate panel prices for the three major categories, while we show the ROC for those categories in Fig. 4 & 5, with the actual prices removed in Fig. 5, leaving only the trend lines.  To better show how severe the price drop was for TV panels, we have included both Fig. 6 & Fig. 7, which show 65” (large) and 32” (small) TV panel pricing for additional clarity, but we also point out that even after the -10.1% drop in aggregate TV panel prices, they are still up 86.96% over the aggregate price in May 2020, the last month where TV panel prices saw declines, so while the drop in August was significant, Fig. 8 shows that over the long-term 32” (and most other) panel prices have been declining, which leaves a big opening as to where TV panel prices will bottom out and more importantly, the effect falling TV panel prices will have on panel producer profitability going forward.  It’s a bit early to forecast September panel pricing, but we are keeping our expectations low for all categories and see little reason for anything more than a situation similar to August thus far.
Picture
Aggregate Monitor Panel Pricing & ROC - 2019 - 2021 YTD - Source: SCMR LLC, IHS, Company Data
Picture
Aggregate Notebook Panel Pricing & ROC - 2019 - 2021 YTD - Source: SCMR LLC, IHS, Witsview, Company Data
Picture
Aggregate TV Panel Pricing & ROC - 2019 - 2021 YTD - Source: SCMR LLC, IHS, Witsview, Company Data
​Figure 4 & 5 - Aggregate Panel Price ROC - 2019 - 2021 YTD - Source: SCMR LLC, IHS, Trendforce, OMDIA, Company Data
Picture
65" Aggregate Panel Prices & ROC - 3 Years - Source: SCMR LLC, IHS, Witsview, Company Data
Picture
32" Aggregate Panel Pricing - 3 Years - Source: SCMR LLC, IHS, Witsview, Company Data
Picture
32" Aggregate Panel Pricing - 10 Years - Source: SCMR LLC, Displaysearch, IHS, Witsview, Company Data
0 Comments

Samsung Offers 98” Mini-LED/QD TV at …

8/23/2021

0 Comments


Samsung Offers 98” Mini-LED/QD TV at …
​

​While we have been carefully tracking Samsung Electronics’ (005930.KS) pricing for it line of Mini-LED/QD TVs since their release in May of this year, Samsung had yet to release the ultra-large units that it had been promising, until now.  Samsung is taking pre-orders for a monster 98” Mini-LED/QD TV that will be selling for a mere $11,112 if you apply all of the possible discounts being offered.  This is not the 8K model, which Samsung was touting last year as the precursor to the ‘retail’ sets now being offered, but is a 4K version, albeit at 11 grand, also a far cheaper one than the $65,800 price tag on the original 8K 98” set, but we expect the supply will be somewhat limited and likely will take some time before it becomes available in the US, so start saving those pennies.
Samsung has also lowered the price (again) on its 8K Mini-LED/QD TV set line, with 5 of the 6 offerings now at their lowest prices since inception.  The top-of-the-line 900A series are now selling for $8,500, $5,500, and $4,500 (85”, 75”, 65”) respectively, down 16.7%, 24.3%, and 20.0% from their original prices, and the 800A series 8K Mini-LED/QD TV are now selling for $5,500, $4,000, and $3,000 (85”, 75”, 65”), down 15.4%, 16.7%, and 14.3% respectively, with only the 65” 800 series set above its lowest price point.
If Samsung’s Mini-LED set pricing thus far is any indication, it would likely be worthwhile waiting a bit before purchasing the 98” model as the sets already released are down 17.9% (8K) and down 11.2% (4K) from their original prices.  Logic says if you can hold out for three months, the 98” model should be selling for a mere $9,867, making it the perfect holiday gift for that someone special.  
0 Comments

Fun with Data – Raw Materials

8/20/2021

0 Comments


Fun with Data – Raw Materials
​

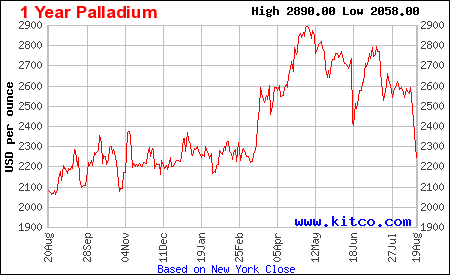
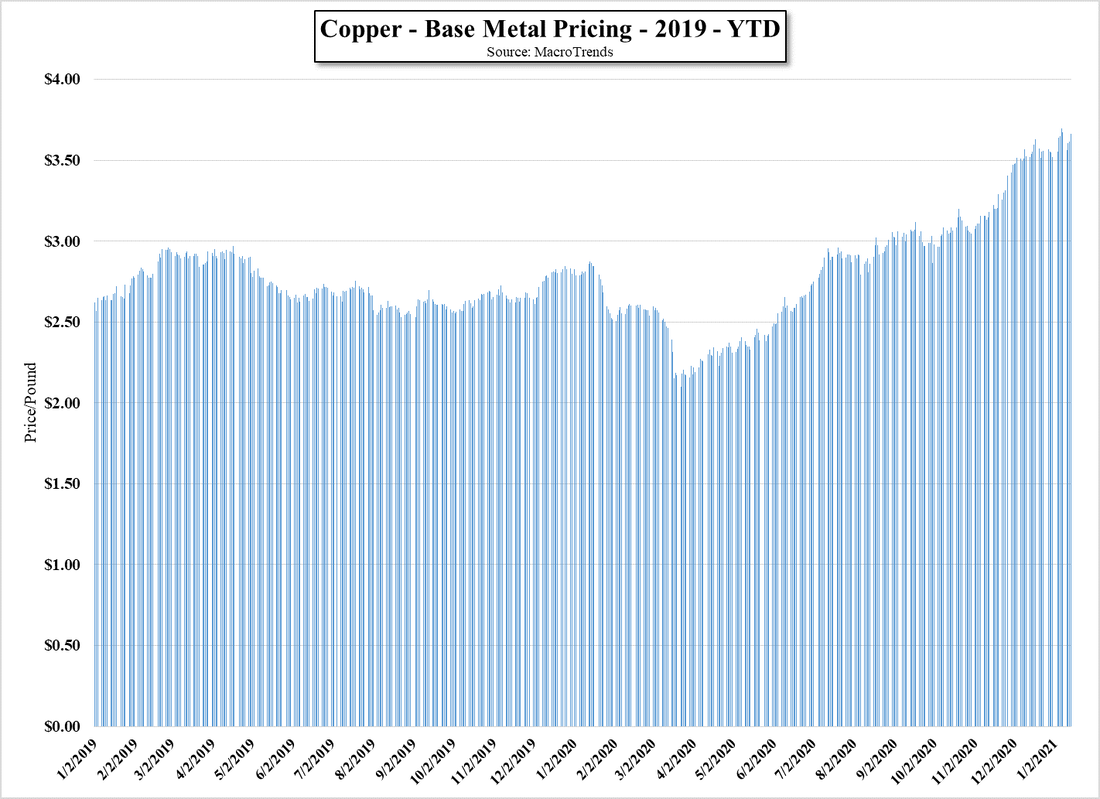
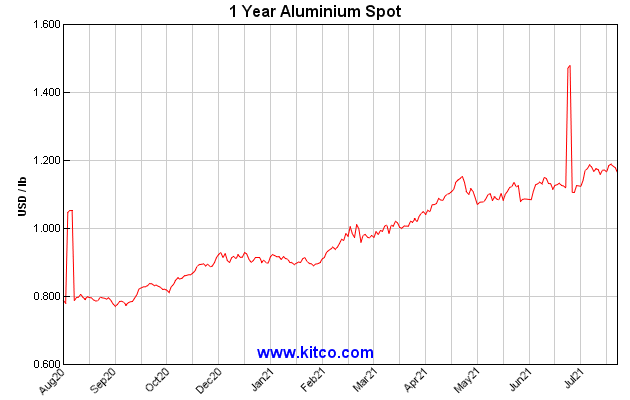
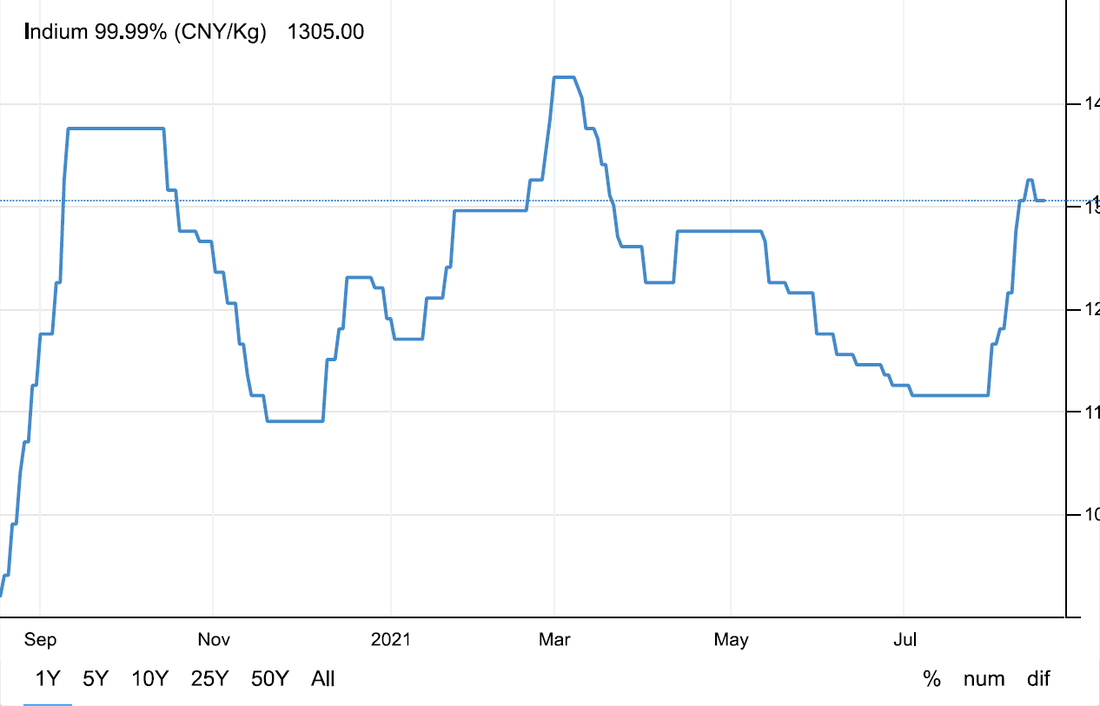
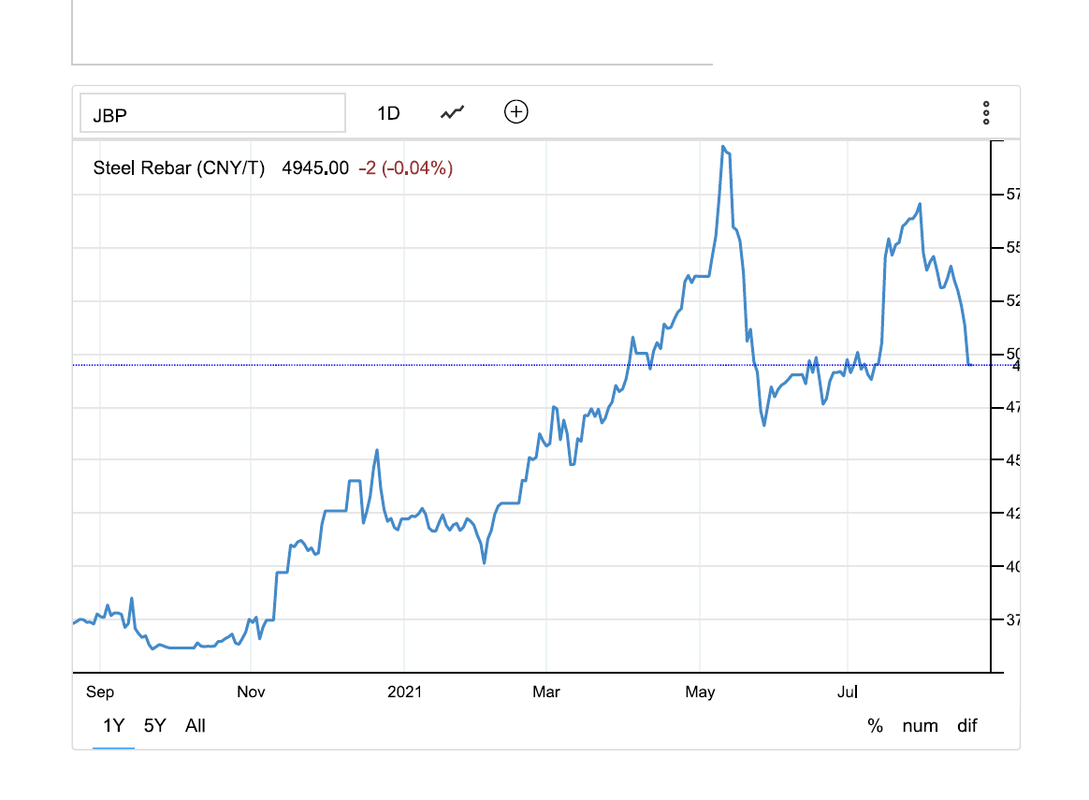
While headlines over shortages in the CE component space continue to draw eyeballs and companies cite rising raw material prices as one of the reasons for weaker than expected profits heading into 3Q, we go back to check on a few of the more important raw materials used in CE products to see how prices have changed over the last few months.  Consistency is certainly not common to prices for many of the more important CE basic materials, with some seeing rapid drops from early 2021 highs after peaking in May, while others continue a steady climb toward new highs, with copper, among the most widely used, down from its May peak but still up since January, and steel, also off its May high but also still up for the year.
3Q, the seasonal build period for CE devices would typically be the quarter in which production gears up and raw material inventories are replenished toward strong holiday demand, and while we are still in an ‘unprecedented’ environment, we expect 3Q to be a bit less frenetic, with weaker demand from TVs and smartphones pushing a bit less on CE raw material prices.  Consumer Electronics production does generate significant demand for some materials, particularly Indium and some rare earths, and while copper is a key raw material for most CE products, there are other drivers that could offset any weakness in CE demand.  While current CE device inventory builds in raw material prices that were seen in May and June, some of that pressure might ease a bit in 3Q and give CE brands a bit of margin breathing room that will be needed to attract consumers at current higher device prices.  Will it be enough to make a difference or will blended inventory pricing mitigate any raw material price reductions?  The Magic 8 Ball says’ “Reply Hazy.  Try Again Later”, say, in 30 days.
Picture
Magic 8 Ball - Source: britannica.com
Picture
Palladium Price - Source: Kitco
Picture
Gold Price - Source: Kitco
Picture
Copper Spot Price - Source: Kitco
Picture
Aluminum Spot Price - Source: Kitco
Picture
Indium Spot Price - Source: Trading Economics
Picture
Steel (Rebar) Price - Source: Trading Economics
0 Comments

Capacity vs Utilization – What’s in a Name?

8/20/2021

0 Comments


Capacity vs Utilization – What’s in a Name?
​

​When looking at large scale manufacturing and panel producers in particular, it becomes apparent that semantics can make a big difference in understanding production capacity.  Panel producers have many names for production metrics and use them selectively, usually to make a positive point, but when it comes down to a realistic view of display production, the words do make a difference.  There is ‘stated capacity’, which is the capacity that was considered when designing the fab, say 90,000 sheets/month at Gen 8.5.  Most would assume that when that term is used one can assume that the fab is fully built out, which is certainly not the case in most instances. 
Display production lines are usually installed in ‘phases’, with the building shell, power, and water feeds installed up front, but the production lines themselves built out in a staggered fashion, say in this case as three 30,000 sheet/month lines.  Once the initial line, which in this case would typically consist of two 15,000 sheet/month sub-lines and a similar set of lines for TFT (Thin-film transistor), is completed, the line goes into test mode, where substrates are run through the line and both optical and electrical inspection tools trace problems on the line.  As the equipment is ‘tuned’ during the test process only a small number of substrate panels are run through the line given that equipment is still being optimized,  and while no client oriented production is being done, many panel producers call the fab ‘open’ when a substrate is able to run from one end of the line to the other. 
The ‘open’ moniker can also be applied even if only a subset of the phase one production lines are running, say one 15,000 sheet/month line, and while there might be equipment set up for the next 15,000 sheet/month increment, it has not yet entered the test mode.  Once all of the phase one line’s equipment is being utilized, even though the fab is only producing small numbers of completed panels, the fab is usually said to be in ‘mass production’. 
This is a key point for panel producers as once a fab enters mass production depreciation begins and both line utilization and yield become the driver for fab profitability.  When fabs begin mass production producers must balance low product yields against fab utilization rates, essentially wanting the fab to be fully utilized to maximize margin, but not wanting to produce high volumes of panels with low yields that generate losses.  Ideally producers want high utilization, meaning the fab in producing at or near its stated capacity, but if product yields are low, meaning many finished panels have to be scrapped, running the fab at full utilization can be quite costly, so low product yield tends to also imply low fab utilization rates. 
Ideally, the production in a fab’s early stage is driven by customer orders, but more realistically much of the early production is for evaluation samples that need to be qualified by customers, regardless of whether they have been supplied by the producers other fabs.  During the qualification process, which can entail modifications to product and/or production processes and a number of iterations for sample panels, most producers will consider the fab ‘ramping’, which implies ‘not at full capacity’ or ‘not at full utilization’ but also with the implication that yields and utilization rates are improving. 
This is where things get quite difficult to decipher, both from the standpoint of gauging actual production (units and value) and profitability, as ‘ramping’ has no modifier.  We have seen fabs ‘ramp’ for a few months and others ramp for years, so utilization then becomes the only way to understand how much a fab is actually producing and that data tends to be released or leaked only when it serves to put the producer in a positive light.  Utilization rates can be calculated if area production is known however many panel producers only give production area metrics based on ‘available capacity’, which means the fabs’ capacity during the period (inclusive of maintenance, downtime, etc.) which is not its ‘stated’ capacity but some subset or superset of that figure.
The implications of true utilization metrics are quite significant and can be very different depending on the display technology and the complexity of the process.  LCD display production, given its ubiquity and maturity as a display modality, typically has a higher utilization rate than OLED production, which has some production peculiarities and potential variations that make its production a bit more difficult and less mature, but the true driver for utilization is the ability of the producer to time new capacity to the market and develop new display products that stimulate customer demand, along with more general global economics and pricing characteristics.
Currently, given the demand cycle created by the COVID-19 pandemic, LCD utilization rates are high for both large and small panel producers, in the low 90% range for small panel producers and in the mid 90% range for large panel producers, while utilization rates for OLED producers are considerably lower, although that varies considerably between producers.  Looking at just Chinese LCD producers and applying a blended LCD utilization rate of 94.2%, that segment of the industry could produce 18.36m 32” panel equivalents in June, vs. just a bit over 20m 32” equivalents for stated capacity, but when it comes to OLED the difference between the number of units actually produced and stated capacity is far more obvious. 
At June OLED utilization rates Chinese OLED producers were able to produce 30.89m 6.5” displays against a stated capacity of what would be 70.37m 6.5” OLED display equivalents, but in July, as OLED capacity at the country’s largest producer BOE (200725.CH) ‘ramped’ at two of its fabs increasing stated capacity by 12.3%, the unit volume improved by 26.3% to 39.02m 6.5” equivalents as overall OLED utilization at Chinese OLED fabs in aggregate increased by 5.5%, showing the production leverage even relatively small improvements in fab utilization can garner.  When coupled with yield improvements that leverage is further magnified.
That said, utilization data is hard to come by and panel producers, particularly those in China are want to be as vague as possible, particularly toward OLED utilization rates, but it is essential for investors to understand the difference between stated capacity and real production, and to understand that terms like ‘improving’ and ‘ramping’ have little meaning unless they are either accompanied by metrics or detailed qualifiers..  Many Chinese panel producers state display project goals, especially when raising project capital, based on what sales the fab would generate when fully built out and running at stated capacity.  As ‘ramping’ toward the goal of full utilization could take a few quarters or many years, a bit these are essentially pie-in-the-sky numbers and should never be confused with realistic production goals based on panel producer experience, the balance between supply and demand, and the maturity of the technology.
0 Comments

The Ultimate in Grocery Delivery

8/20/2021

0 Comments


The Ultimate in Grocery Delivery
​

While the COVID-19 pandemic has been a dreadful experience for humanity, it has perhaps accelerated a few lifestyle changes that had already been gaining some momentum.  One such is grocery shopping, a tortuous task involving examining and touching things that many other people have touched, and trying to anticipate what you or others might be desirous of days in advance.  Of course there are some pleasurable moments during grocery shopping, such as discovering that Entenmanns is having a BOGO on chocolate donuts or finding mismarked artichokes selling for $0.28 instead of $2.28, but that is usually offset by screaming children in auto-like shopping carts or those wonderful folks who are on their phones while wandering aimlessly through the aisles, or those that pay with cash and coins and don’t bother to find their money until after everything is rung up and packed and the line stretches across the store.
Grocery home delivery services are certainly a step in the right direction, although leaving produce selection to a 19 year-old who has purple hair and two nose rings can be iffy, but even better are the services where you place your order on a site and they bring your groceries to your car while you remain in the parking lot.  This does give you some time to check for missing items or to actually speak with the person that collects your items, but soon that will all change if Elon Musk gets his way.
As part of Project Dojo, the designation given to Tesla’s (TSLA) AI chip development program, Mr. Musk introduced yesterday an enlightened version of  the Tesla Bot, a 145 lb humanoid robot, that is not only ‘friendly’, but can free you from ‘dangerous, repetitive, or boring tasks’.  The bot can carry ~45 lbs of ‘stuff’.  Intentionally, the speed of the robot max’s out at 5 mph so if the bot suddenly decides it is interested in world domination you can run away from it, and even if it catches you, you should be able to overpower it.  Rather than a face, the bot will have a screen to reveal ‘useful information’, will be built from lightweight materials and have over 40 actuators to allow freedom of movement.
Most important are the cameras, neural networks and systems used in Tesla’s ‘self-driving’ vehicles, which means it should be able to avoid running into almost anything other than emergency vehicles parked nearby with their lights flashing.  Mr. Musk expects that such a bot should be able to perform tasks without explicit pre-training, easily responding to the sentence, “Go to the grocery store and buy chocolate donuts and artichokes”, singling out the arduous task of grocery shopping in his presentation.
We are all for the technology, which unfortunately has no timeline attached, although we are a bit hesitant about using the same collision avoidance software and hardware that is used in Tesla vehicles today, but more importantly we want to know how these new Tesla bots will deal with their elderly brethren, such as Marty, the Stop & Shop™ robot.  Will there be a caste system where the Marty’s of the bot world will have to clean and oil their more sophisticated colleagues, or will there be a place where the ‘Marty’s’ go to retire, spending their days sitting by the window, waiting for someone to come by and spill a soda on aisle 14?  Hopefully the Tesla bot will also have ‘enlightened’ abilities that will give it a ‘humanized’ moral compass, sort of a ‘woke bot’ that will be able to see us humans as the nice folk we really are and not a race of mindless couch potatoes that spend all day checking their Twitter (TWTR) account, or maybe we should just stick with Marty and get our own groceries.  He is very non-judgmental as long as you stay out of his way and don’t block the doors to the stock room.
Picture
Tesla Bot (1) - Source: Tesla
Picture
Tesla Bot (2) - Source: Tesla
Picture
"Marty" - Source: Stop & Shop
0 Comments

BOE Raises $3.14b

8/19/2021

0 Comments


BOE Raises $3.14b
​

China’s largest panel producer BOE (200725.CH) announced that it had placed 3.65b shares of its common stock with a group of private investors, raising $3.14b US.  The share (new) were priced at 5.75 yuan, with bids ranging from 5.64 to 6.3 yuan and carry a 6 month lockup for all purchasers except the largest buyer, who agreed to an 18 month lockup.  The new shares increased the total company shares by 10.5% to 38.45b shares for a market value of $46.037b US at the subscription price.
As previously stated the funds will be used for the following:
  • Acquire 24.06% of Wuhan BOE Optoelectronics, the holding company for the company’s Gen 10.5 fab in Wuhan
  • Continue the building and expansion of the company’s Gen 6 OLED fab in Chongqing and increase holding company capital
  • Fund the company’s 12” silicon OLED micro-display project
  • Add capital to the company’s Hospital project in Chengdu
  • Repay Loan from Fuzhou Urban Investment Group
  • Increase overall capital structure to avoid debt ratio issues
We were curious as to who purchased the shares, given the size of the deal.  The table below shows the deal participants, their business and the share of the offering that they subscribed for:
Picture
While the two directly state owned entities took over 22% of the deal, we were more interested in BOE’s top 10 shareholder list, both from any change in control (none) and the composition of the holders.  As can be seen in the table below, the only non-state owned holder of BOE shares (top 10) is the Hong Kong Stock Exchange (388.HK), although while still state owned, the Central Bank of Norway is certainly not owned by the Chinese government, as are all of the other entities.
Picture
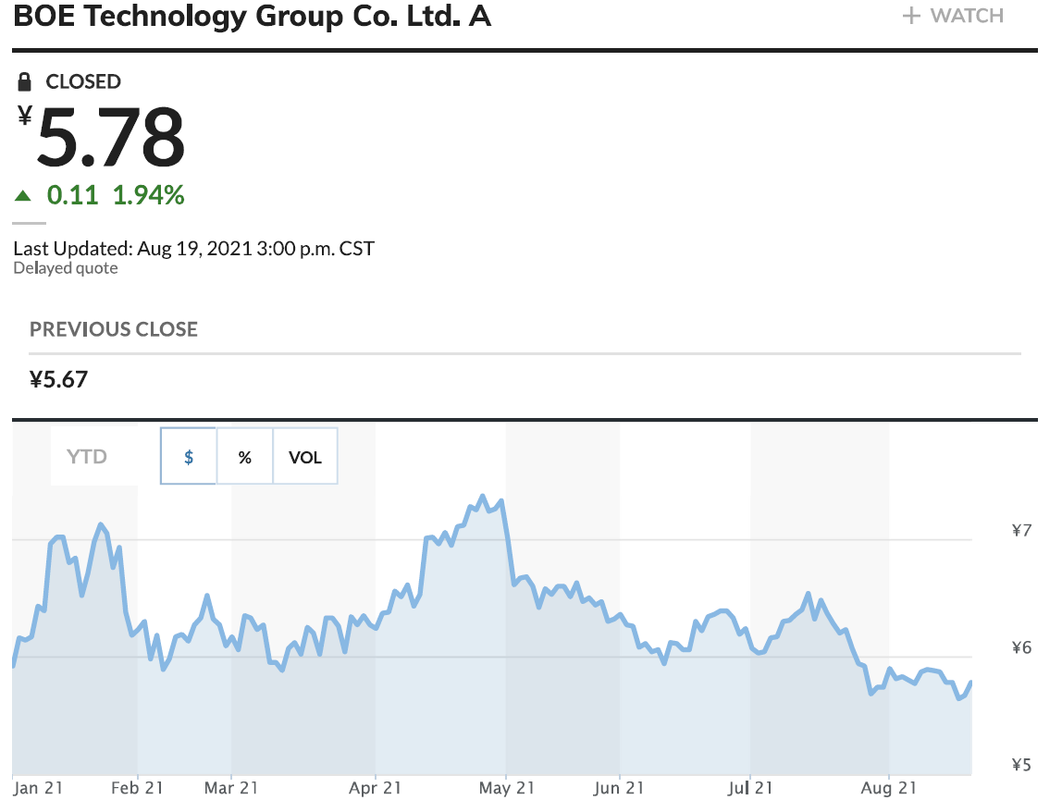
This deal has been weighing on BOE shares for some time, with considerable pressure from individual shareholders who were concerned that not only was the deal depressing the stock but that private shareholders would be offered stock at a substantial discount, a practice not uncommon with Chinese technology companies.  Perhaps with the deal out of the way, some of that pressure will be off the stock, however the lockup is relatively short and the prospects for the LCD display segment have likely peaked or are near so. 
BOE continues to push to gain traction with Apple (AAPL) in the OLED space, and while they still have yet to become a primary supplier, we expect much of this deal promotion was based on that potential.  Apple tends to keep its actual suppliers from disclosing orders, more so lately given the number of ‘leaks’ that seem to appear weekly, but there is a considerable amount of time before Apple will have to commit to BOE for the next generation iPhone, which leaves plenty of time for rumors to ebb and flow as to BOE’s prospects.
Picture
BOE A Shares - YTD Stock Price Chart - Source_ Marketwatch
0 Comments
<<Previous
Forward>>

    Author

    We publish daily notes to clients.  We archive selected notes here, please contact us at: ​[email protected] for detail or subscription information.

    Archives

    May 2025
    April 2025
    March 2025
    February 2025
    January 2025
    January 2024
    November 2023
    October 2023
    September 2023
    August 2023
    June 2023
    May 2023
    February 2023
    January 2023
    December 2022
    November 2022
    October 2022
    September 2022
    August 2022
    July 2022
    June 2022
    May 2022
    April 2022
    March 2022
    February 2022
    January 2022
    December 2021
    November 2021
    October 2021
    September 2021
    August 2021
    July 2021
    June 2021
    May 2021
    April 2021
    March 2021
    February 2021
    January 2021
    December 2020
    October 2020
    July 2020
    May 2020
    November 2019
    April 2019
    January 2019
    January 2018
    August 2017
    July 2017
    June 2017
    May 2017
    April 2017
    March 2017
    February 2017
    January 2017
    November 2016
    October 2016
    September 2016

    Categories

    All
    5G
    8K
    Aapl
    AI
    AMZN
    AR
    ASML
    Audio
    AUO
    Autonomous Engineering
    Bixby
    Boe
    China Consumer Electronics
    China - Consumer Electronics
    Chinastar
    Chromebooks
    Components
    Connected Home
    Consumer Electronics General
    Consumer Electronics - General
    Corning
    COVID
    Crypto
    Deepfake
    Deepseek
    Display Panels
    DLB
    E-Ink
    E Paper
    E-paper
    Facebook
    Facial Recognition
    Foldables
    Foxconn
    Free Space Optical Communication
    Global Foundries
    GOOG
    Hacking
    Hannstar
    Headphones
    Hisense
    HKC
    Huawei
    Idemitsu Kosan
    Igzo
    Ink Jet Printing
    Innolux
    Japan Display
    JOLED
    LEDs
    Lg Display
    Lg Electronics
    LG Innotek
    LIDAR
    Matter
    Mediatek
    Meta
    Metaverse
    Micro LED
    Micro-LED
    Micro-OLED
    Mini LED
    Misc.
    MmWave
    Monitors
    Nanosys
    NFT
    Notebooks
    Oled
    OpenAI
    QCOM
    QD/OLED
    Quantum Dots
    RFID
    Robotics
    Royole
    Samsung
    Samsung Display
    Samsung Electronics
    Sanan
    Semiconductors
    Sensors
    Sharp
    Shipping
    Smartphones
    Smart Stuff
    SNE
    Software
    Tariffs
    TCL
    Thaad
    Tianma
    TikTok
    TSM
    TV
    Universal Display
    Visionox
    VR
    Wearables
    Xiaomi

    RSS Feed

Site powered by Weebly. Managed by Bluehost