Supply Chain Market Research - SCMR LLC
  • Blog
  • Home
  • About us
  • Contact

Mini-LED/QD Obsession – Yes, More…

11/9/2021

0 Comments


Mini-LED/QD Obsession – Yes, More…
​

As we continue to follow Samsung’s (005930.KS) Mini-LED QD offering prices in the US into the holidays, we see two new entrants into the mix.  The first is one that has appeared and then became unavailable, a 43” version of the 90A series (Mini-LED/QD 4K), which has returned at its original price of $1,300 and a new model in the same group, a 98” Mini-LED/QD 4K set that enters at $15,000.  While the smaller set is in a normal price range, the 98” set is not and the simple calculation of cost/in2 shows that for an increase of 32.9% in surface area over the equivalent 85” set, you pay 355% more.  This comes to $1.07/in2 for the 85” set and $3.65 for the 98” set, which makes obvious the fact that prices for newly released TVs are usually their highest lifecycle point.
On a more general basis, much of the price reductions seen in our most recent check have taken place in the 4K Mini-LED/QD category and among sets that are just quantum dot enhanced, but looking at the entire list (excluding the two new entries), all but two of 33 (93.9%) are at their lowest point since initial release (5/20/21), with the average price decline 27.3%.  The models with the greatest declines fall into the 8K Mini-LED/QD 900A Series (Top of the line), where prices have fallen 34.0%, and the middle price tier of 4K Quantum Dot sets, where prices are now 31.4% lower than initial release.  When looking at all Mini-LED/QD TVs, the average price is now down31.7% and looking at all QD only TVs, the average price is down 23.6%.  The average price reduction on those sets that saw m/m reductions was -12.3% and across all sets (including those that remained flat) the price reduction was 6.3%.
As we get closer to Black Friday (11/26), we expect another round of price reductions although it seems Samsung has most recently been focusing on lower priced sets, likely to meet unit volume targets.  While we cannot check actual stock at Samsung USA, we did check to see how many models could be shipped ‘next day’, which would indicate stock at a nearby Samsung warehouse or distribution center.  Of the 33 models checked (neither of the two new models were available), 66.6% were available for next day shipping with the remaining 33% shipping within 14 days, other than two models (8K 85” Mini-LED/QD top-of-the line $5,500  and 65” 4K Mini-LED/QD $1,700) that would not ship until 12/3/21, which would indicate stock is readily available for most models.
With 18 days to the first big holiday in the US, we would expect at least one more round of price reductions past the current discounts, which Samsung calls ‘Early Black Friday Deals’, and as the holiday selling season this year covers even more ‘holiday selling days’, given the progressively earlier ‘pre-pre holiday’ discounting already seen, we expect the Samsung Mini-LED/QD and QD only TV line will continue to see price reductions through the end of the year.
Picture
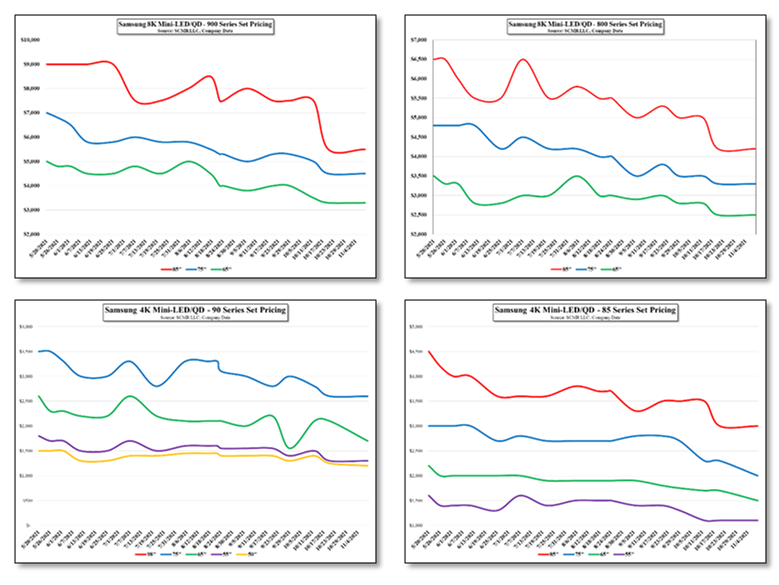
Samsung Mini-LED QD TV Set Price Charts - Source: SCMR LLC, Company Data
Picture
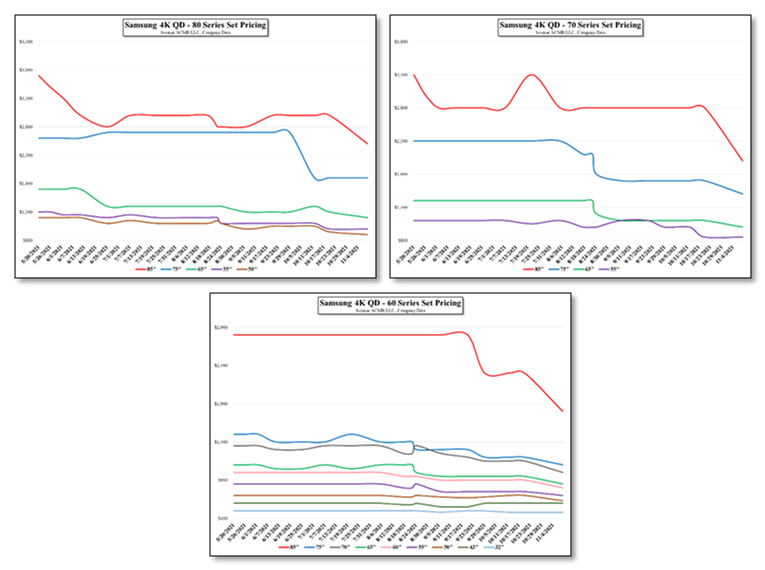
Samsung QD TV Set Pricing Charts - Source: SCMR LLC, Company Data
0 Comments

Taiwan Panel Producer Results – October

11/9/2021

0 Comments


Taiwan Panel Producer Results – October
​

October results were down for all three panel producers in Taiwan, which gives some indication of results for those panel producers that are not seeing an offsetting increase in capacity.  While AU Optronics (AUOTY) no longer provides large/small monthly panel data, we expect they saw a reduction in both large and small panel sales in October.  AUO still has room to garner positive y/y sales in November, but a strong December last year will make that month a hard comparison, although we expect early 2022 monthly comparisons will return to the positive as sales in January/February of this year were weak.  Starting in March however we expect a more difficult time showing positive y/y sales results.
Innolux  (3481.TT) has less wiggle room on a y/y sales basis, but relatively consistent large panel shipments have helped to maintain positive y/y monthly sales, however small panel shipments dropped to a yearly low in October, which will impact profitability as small panels are the most profitable on a m2 basis.  Hannstar (6116.TT), which is focused on small panel production, saw a continuation of sales declines that began after a peak in small panel production back in March as smartphone demand continues to wane.  We would not expect much change until production for the next smartphone cycle resumes in March 2022.
 
Picture
Picture
Monthly Sales - 2018 - 2021 YTD - Source: SCMR LLC, Company Data
Picture
Innolux - Monthly Sales - 2018 - 2021 YTD - Source: SCMR LLC, Company Data
Picture
Innolux - Large Panel Shipments - 2018 - 2021 YTD - Source: SCMR LLC, Company Data
Picture
Innolux - Small Panel Shipments - 2018 - 2021 YTD - Source: SCMR LLC, Company Data
Picture
Hannstar Monthly Sales - Source: SCMR LLC, Company Data
0 Comments

Samsung Gets Vietnam Factory Back On Line

11/8/2021

0 Comments


Samsung Gets Vietnam Factory Back On Line
​

​As we noted in our 10-18-21 note, a number of the factories in Ho Chi Minh City had been under partial quarantine or reduced staffing as the city faced a number of COVID-19 outbreaks in September and October.  Last month it was estimated that Samsung’s (005930.KS) plant in the Saigon Hi-Tech Park 10 miles outside of the city, was operating with about 50% of its normally ~7,000 employees, with the company helping those workers who wished to stay during travel restrictions by providing local sleeping and eating arrangements.
The factory, which assembles both Samsung TVs and home appliances has been in operation since 2016 and generated over $5.3b in revenue last year, making it the 2nd largest Samsung assembly facility.  Samsung generating more than $56b in export sales in Vietnam and produced over 19m units last year, so low level production at this factory does have a material effect of Samsung’s overall CE sales, which grew 0.1% y/y in 3Q, with the TV segment declining 5%.  Expectations were that the factory would be back to full production by the end of this month as the city eases travel restrictions, but it seems that Samsung has been working with the local government to accelerate that timeline and has brought the lines back to full production last week, considerably ahead of schedule.
Over the last five years TV shipments in the 4th quarter averaged 28.8% of the full year total, but that included 2020 which saw an unusual 2Q as government stimulus checks pulled in normal seasonality.  Looking at the four years without 2020, the average is just under 31%, making it essential that Samsung squeeze out as much as possible from this factory in order to meet its unit volume targets.  Samsung has been fighting a battle against both its local rival LG Electronics (066570.KS) and Chinese brands, particularly TCL (000100.CH) who has been accepted by a number of US retailers over the last two years and has become a major player in the North American market, while Xiaomi (1810.HK) has expanded significantly in China and Asian markets.  
0 Comments

BOE – A Quiet Celebration

11/8/2021

0 Comments


BOE – A Quiet Celebration
​

​On October 29, BOE (200725.CH), China’s largest panel producer, held a quiet ceremony marking the final certification needed to become a full scale OLED supplier to Apple for the iPhone 13 line.  As we have noted on numerous occasions, this has not been an easy path for BOE, as the company was unable to qualify for full production at least twice that we know of, and was most recently put on a limited production schedule until final certification could be affirmed.  While BOE has been producing small panel OLED for Apple, an estimated 5.5m units in 1H, the final certification proves out the company’s ability to reach both quality and production goals set by Apple, with an additional 6.5m units produced between July and the end of October, and a current run rate of between 1.5m and 1.9m units/month.  According to Chinese press, by the end of the year this run rate would represent ~10% of Apple’s iPhone shipment target of 160m units, with BOE showing a total of ~50m OLED units (all customers) this year.
In 2022 BOE should be increasing capacity at its Gen 6 Chongqing OLED fab as phase 2 capacity begins production.  While the local press says that production will start in January, and BOE will increase shipments to 80m units next year, we expect mass production, based on a more conservative ramp to see an incremental 27m units from Chongqing in 2022, but we note that is at 100% yield, which we expect is far different than what is seen currently and what will be the case as the new Chongqing lines ramp up.  While we expect BOE will certainly be a bigger contributor to Apple’s OLED supply chain in 2022, we hesitate to make predictions as to absolute share as much will depend on BOE’s ability to ramp production to a viable yield, and BOE’s ability to produce the particular OLED display variations that Apple will request in 2022. 
As we expect most, if not all of the LTPO OLED displays for the top iPhone models will be produced by Samsung Display (pvt), and LG Display (LPL) will produce much of the intermediate model, BOE’s share will be limited somewhat, depending on Apple’s application of LTPO across the iPhone line.  This is certainly a big win for BOE, after a long and difficult path to success, but we expect the Chinese press will take the win to mean that BOE’s ‘glorious success’ will ‘mark the end of South Korean OLED domination’, a bit of a stretch in 2022.  It does mean more competition for both SDC and LGD, but we assume they have been expecting that for some time
0 Comments

Fun With Data – Smartphone Share

11/8/2021

0 Comments


Fun With Data – Smartphone Share
​

​While all local smartphone markets have their own characteristics, the US smartphone market is quite different from other large markets.  It is expected to garner a ~10% share of the overall smartphone market with a population that represents ~4.2% of the global total, while China, with 18.3% of the global population, is expected to be 26.7% of global smartphone share at the end of this year, although both are expected to see negative growth this year.  In 3Q Samsung took the top share in the global smartphone market, although we expect Apple (AAPL) will take that position in 4Q on sales of the iPhone 13 series, but the number 3 brand globally, Xiaomi, doesn’t appear in the US, unless it falls into the ‘other’ category, which in total came to 7% in the US in 3Q.
In the US Apple was the share leader in 3Q at 42%, growing 3% from last year’s 3Q, while Samsung took a 35% share, up 5% from last year.  LG Electronics, who last year had a 13% share in the US market (3Q) is defunct, with much of that share falling to Apple and Samsung.  There were two Chinese brands that registered in the US smartphone market in 3Q, TCL and OnePlus (pvt), with 5% and 3% respectively, while Samsung did not register in China, although Apple had a 13% share in 3Q.  Oppo (pvt) and Vivo (pvt) were the two brands in China with the largest share in 3Q, at a combined 43%, both of whom are owned by the same private company, and Honor (pvt), formerly a Huawei (pvt) sub-brand, came in just above Apple (13%) and Xiaomi (14%) at 15%.
Last year in 3Q, the Chinese market was dominated by Huawei with a 35.6% share, which is now down to 8% because of trade restriction imposed by the US that limit the company’s ability to access Google (GOOG) store applications. So, while the US is a diverse smartphone market in terms of brand source, China is not, with 89.9% of new models released in 3Q coming from Chinese based brands.  With Apple and Motorola the only US based brands in the US market, there is plenty of room for competition for US smartphone dollars, although based on what is currently available from US carriers, there are really few choices other than Apple, Samsung, and Google, with a smattering of Nokia and last year’s LG phones.  
Picture
US Smartphone Market Brand Share - 3Q 2021/2020 - Source: Counterpoint
0 Comments

Notebooks Good - Chromebooks Ba

11/8/2021

0 Comments


Notebooks Good - Chromebooks Ba

We have mentioned a slowdown in the Chromebook market a number of times, with the earliest indication being in our 8/16/21 note and again on 9/27/21 and 10/25/21, but our expectations for the decline in Chromebook demand now seems conservative as we aggregate data from a number of sources.  We had expected a decline of ~17.5% q/q, which would still have implied a 3Q y/y gain of 5.2%.  With a number of sources in thus far, it looks like the aggregate q/q decline is down~49.0%, putting 3Q y/y down 34.8%, far worse than our estimate and the first negative y/y growth quarter for Chromebooks.  Some of the decline might be attributable to component shortages, but more likely the more extreme decline is due to delays or ending of new fiscal year budgets for student laptop/Chromebook programs, a number of which are ending are facing scrutiny as students in many countries are returning to class this fall.
Notebooks overall, of which Chromebooks comprises a share of 7.7% in 3Q (peaked out in 1Q of this year at 20.1%), have fared better, up 9.2% q/q and up 10.7% y/y , although it is the slowest notebook y/y growth since the pandemic began in 2020.  The growth in notebook shipments came from some orders that had not been filled in 2Q due to component shortages and stronger corporate growth coming from those employees that have returned to a full office daily routine.  As we have previously noted, retail notebook sales, the driver in past quarters, have slowed as student laptop programs become less necessary, so the question to be answered over the next two quarters will be “Will the corporate notebook expansion be able to offset slower retail notebook growth?”.
We expect notebook panel shipments to decline between 1% and 1.5%, as we noted in our 11/04/21 note, but worry that while anticipation of Chinese New Year (Feb. 1) and new notebook announcements at CES (Jan. 5) might keep notebook brand target expectations high into 1Q ’22, we are less sanguine about the overall notebook picture in 2022 as COVID-19 sequesterization (?) wanes.  While we don’t expect a major drop in notebook shipments in 1H ’22, it will certainly become harder to see y/y growth against 2021’s strong COVID-19 related demand.  While Chromebooks were the device of choice for on-line student programs, we expect they will fall back into a more normalized volume, showing lower unit volumes and very tough y/y comparisons.  That said, we expect over the long-term, Chromebooks do represent a valid concept that is ideal for situations where most of the use is based on on-line applications and storage, especially if Chrome based applications that allow for data exchange between Microsoft (MSFT) applications continue to grow. 
Picture
Aggregate Chromebook Shipments - Source: SCMR LLC, Various
Picture
Total Notebook & Chromebook Shipments - Source: SCMR LLC, Various
Picture
Notebook Shipments & ROC - Source: SCMR LLC, Various
0 Comments

Universal Display – Erratic Behavior?

11/5/2021

0 Comments


Universal Display – Erratic Behavior?

Universal Display (OLED) reported 3Q revenue of $143.62m, up 10.8% q/q and up 22.7% y/y.  EPS was $0.97, up 13.7% q/q and up 13.6% y/y.  Both estimates missed consensus of $147m and $1.09, however the company reiterated full year guidance of $530m to $560m, which implies $123m to $153m in 4Q sales, which on a q/q basis is between -14.4% and +6.5%, on a y/y basis is between -13.1% and +8.1%, and also implies a full year sales increase between 23.6% and 30.6%.  Consensus for the full year is $551.  UDC finished the quarter with $16.66 in cash/ST Inv.
The stock has not done well this year, down 19.7% based on yesterday’s closing price, and will likely see additional pressure today, in a year where OLED displays have seen continued adoption and penetration into new markets.  We do not look at UDC from the standpoint of relative value but from the company’s ability to generate sustainable growth, which gives us a bit of a different perspective than those looking to capitalize on short-term trends.  This ‘bigger picture’ does encompass considerable variability in quarterly results, both to the upside and downside, and the stock is certainly not for those looking for price stability, but we see our objective as presenting UDC’s prospects, good and bad, giving investors the ability to see if the sum of those factors are suitable for their goals.
UDC’s business is selling OLED materials, which includes green and red phosphorescent emitters, including a yellow/green that is used in OLED TV panels.  Their customers are those panel producers that have commercial OLED display fabs and to a lesser degree companies or institutions that are involved in OLED R&D projects or pilot production lines.  The company’s top 4 customers have made up between 65% and 99% of the company sales, with that number averaging 87% over the last 8 quarters.  This is even more concentrated when looking at the top two customers who together averaged 71% of sales over the same period. 
This concentration, and the fact that UDC is really a JIT material supplier lead to the sales volatility that is part of UDC’s nature.  Over the long-term this will lessen, but both Samsung Display (pvt) and LG Display (LPL), UDC’s two largest customers will likely continue to expand OLED production at a rapid pace with producers outside of South Korea also building capacity but implementing production at a slower pace.  BOE (200725.CH), UDC’s 3rd largest customer, has been the most aggressive of the Chinese OLED producers and will see increased unit volumes in 2022 and 2023 as it joins Apple’s (AAPL) OLED supply chain, but on a raw OLED capacity basis lags considerably behind both SDC and LGD.  While utilization rates at each OLED producer is another factor in determining their need for OLED materials, raw capacity would represent the best case scenario. 
We see raw OLED capacity growth between 2021 and 2025 with a CAGR of 13.2%, however aside from the gross capacity and fab utilization rate, panel producers change the mix and proportions of the emitter materials in their displays.  While the cost reduction objective is always there, OLED displays are promoted as having superior display characteristics as to display quality, and we believe that maintaining or improving that quality takes precedence over emitter material cost., so while the fear that panel producers will continue to find ways to reduce the amount of emitter material used per m2, we see other factors as more important, and look at emitter material sales on a longer-term basis.  We show both absolute and smoothed (6 quarter average) for both green and red emitter materials below.
Picture
Picture
Raw OLED Capacity - Source: SCMR LLC
Picture
Green Emitter Sales - Source: SCMR LLC, Company Data
Picture
Green Emitter Sales Smoothed - Source: SCMR LLC, Company Data
Picture
Red Emitter Sales - Source: SCMR LLC, Company Data
Picture
Red Emitter Sales Smoothed - Source: SCMR LLC, Company Data
While previous purchases and inventory levels at each OLED panel producer guide quarterly emitter material levels, all full color RGB displays contain red emitter, with the biggest category for RGB displays being smartphones.  With displays in the 6” to 7” range the emitter material usage is relatively small, but the numbers are large, with the OLED penetration rate in that category nearing 50%.   All three of UDC’s top customers are considering adding capacity for a move toward producing OLED displays for laptops, some of which has already begun.  As adoption in this relatively new category takes time, as it did with smartphones, we keep our expectations low, but based on the size of the average laptop (we use 14” in this example and a 6.5” smartphone average), the surface area to be coated in a laptop would be 4.6 times that of a smartphone.  This is incremental business for OLED panel producers and for UDC, and would translate to improving red emitter sales under a constant utilization rate scenario.
UDC’s green emitter has a dual function.  It is part of the OLED stack in the abovementioned RGB devices but is also used, in a modified form, as the basis for most OLED TV displays, which are produced exclusively by LG Display.  Again the unit volumes are far smaller than for smartphones, roughly 8m units will be produced this year, but using a weighted average, the surface area of an OLED TV would be the equivalent of 93 smartphones, which, at 8m units this year, would be the equivalent of 745m smartphones, equal to roughly a 50% share equivalent.  Next year LGD is expecting to produce 10m units as it expands its large panel OLED capacity in China, which would represent a 20% surface area increase in yellow/green OLED material, aside from increases in other RGB product categories for green emitter material.
While panel producers evaluate emitter needs on a longer-term basis when planning, the production of OLED displays, both large and small, is full of timing variables, and those variables make predicting UDCs material sales on a short-term basis a very hit or miss proposition, however even with the caveat of higher efficiency OLED production processes, the long-term growth of UDC’s phosphorescent emitter business is tied to capacity, which itself is tied to OLED applications.  As older applications see continued higher penetration rates, new applications bring a need for new capacity and that drives emitter material sales and therefore license and royalty recognition.  While OLED penetration in the smartphone space will slow on a percentage basis, small penetration rate increases in notebooks and TVs will have a disproportionally larger effect on OLED surface area, which will demand more OLED emitter material, and while competition from existing LCD technologies will remain, we expect OLED technology will continue to grow for the next few years.  As the de facto supplier of phosphorescent emitter materials UDC would be the primary benefactor from that growth.
That’s the good news, despite the current investor disappointment with 3Q results, but there are points that can weigh on what looks to be a period of continuing OLED penetration in the display space.  One such issue is margins, particularly material margins, which seem to counterbalance investor enthusiasm toward UDC’s growth prospects.  On a quarterly basis, customer product mix plays into quarterly material margin variations, and that is a variable that cannot be easily quantified without internal customer data, but there are other considerations that come into play with material margins that we explore further below.
UDC bases its OLED emitter material pricing on a schedule based on volume, with price reductions triggered by meeting predetermined volume levels until a ‘terminal’ volume is reached when the price remains.  Should UDC present a new emitter material to a customer that is adopted, the price of that material returns to its initial value and follows the same volume reductions as its predecessor.  This makes it incumbent on UDC to continue to develop new and better emitter materials to bring individual customer emitter prices up and counteract any material efficiency improvement that OLED producers might derive but also adds to sales lumpiness as new emitter material adoption at OLED producers is an on-going process which does not always occur across all products or fabs, which can delay or obfuscate the price improvement until the producer fully adopts the new emitter material.
This method of pricing is good for both parties as it pushes UDC toward new emitter material development that improves OLED display quality, but it does have its downside and that is that such fixed volume price points do not allow UDC to renegotiate existing material pricing if raw material costs change, and with the heavy metal component of most phosphorescent emitter being Iridium, UDC has had to absorb the increase in Iridium prices seen this year.  As UDC has been a longtime buyer of Iridium, they are sensitive and quite aware of the unusual pricing seen in Fig. 2 and Fig. 3, but have little choice but to purchase needed stock despite the higher cost, which is reflected in Fig. 5 which relates raw material inventory to material sales and depresses material margins (Fig. 6), as UDC is locked into a contractual price for the current set of emitters.  If we understand the emitter pricing structure at UDC correctly, if raw material prices remain high, new materials will be able to pass those increases on to customers, something existing material pricing does not allow, so material margins would improve over the longer-term, even at the higher material cost.
Picture
Iridium - 1 Year Price Chart - Source: Mining.com
Picture
Iridium - 5 Year Price Chart - Source: Mining.com
Picture
Universal Display - Inventory Breakdown - Source: SCMR LLC, Company Data
Picture
Universal Display - Raw Material Inventory as a Percentage of Material Sales - Source: SCMR LLC, Company Data
Picture
Universal Display - Material Margins - Source: SCMR LLC, Company Data
​UDC’s ‘other’ business is licensing its IP to those who wish to produce OLED displays on a commercial basis.  Since the adoption of ASC 606, the recognition of such license and royalty revenue is tied to material sales, which exaggerates the effect of periods of extreme material sales.  While this avoids the big swings UDC previously saw due to the twice yearly license payments from Samsung Display, it also obscures the increases in absolute license and royalty revenue that comes from increased unit volumes at UDC’s customers.  All but one of UDC’ customers royalty rates are based on a percentage of the display price as it leaves the factory.  A large increase in unit volumes at a particular UDC customer, which before ASC 606 would show in quarterly results, might now be constrained by it s recognition being tied to material sales.
In a situation where a customer purchased considerable emitter stock in a previous quarter and used that stock to produce a large incremental unit volume in the current quarter, the increased royalty license revenue recognition would be tied to lesser material sales in the current quarter and would not give a true impression of the incremental royalty generated by increased unit volumes.  Again this leads us to looking at all of UDC’s metrics on a longer-term basis and to suppress the desire to predict material sales and license/royalty on a short-term basis.  Of course there will be issues that could affect even the longer-term metrics, but trying to predict the month to month material order patterns of three or four OLED producers is not only an impossible task but one that will inevitably miss the bigger picture.   To us, knowing what to look at on a long-term basis is the key to understanding UDC’s business and how it will grow in the future. 
0 Comments

Reinvention

11/4/2021

0 Comments


Reinvention

​When things get tough companies have two choices.  They can knuckle under and hope that a cycle will flip and things will eventually right themselves, not always the ideal choice, or they can reinvent themselves.  Many of those that took the first path are no longer with us or have managed just to stay above water, while a number of the ‘reinventers’ are among the most well-known brands.  An example of the former would be Timex (pvt) a well-known watch company that reinvented itself in 1982 by releasing the Sinclair Personal Computer, the first PC to sell for less than $100.  Unfortunately the Sinclair was so small that it could almost nothing, and within two years the company went back to exclusively selling watches. 
On the opposite side, there is Netflix (NFLX), who went from DVD rental to streaming and became the largest streaming service on the planet, or Amazon (AMZN), going from book-seller to selling everything as the world’s largest on-line retailer.  So the idea of company ‘reinvention’ is not a new one, but is also a risky business, and in some cases it is not a voluntary choice.  Take Huawei (pvt) formerly the world’s largest provider of communication equipment and at times, the largest smartphone brand.  US trade restrictions have caused Huawei to see its smartphone business, especially outside of China, almost disappear, and anti-China sentiment based on claims that Huawei’s telecommunications equipment allows calls to be monitored through intentional ‘backdoors’, has made it difficult for the company to sell such equipment to those closely allied to the US.
Ren Zhengfei, the company’s founder and largest shareholder recently issued a statement at its “No Retreat is the Road to Victory – Legion Formation Meeting” as a battle cry to workers and management.  "I think peace is achieved. We must use hard work and heroic sacrifices to create a peaceful environment for the next 30 years, so that no one will dare to bully us again. We are doing it for ourselves and also for the country. To die for the country, the sun and the moon shine; the phoenix nirvana, man and sky admire you. History will remember you, wait for the day when we drink the celebration wine together, listen to the thunder in the silent place." 
Whether this speech served as a rallying point for company workers or not remains to be seen, but the company has joined the ranks of the ‘reinventers’ this year by creating a number of new business units, such as the Customs & Port Corps, the Smart Highway Corps, the Data Center Energy Corps, and the Smart Photovoltaics Corps, and earlier this year set up the Coal Mine Corps, all of which are intended to diversify the company’s revenue base and create new income opportunities.   While the coal mining business in China has been a pointof focus recently, given China’s power reduction mandates, Huawei is not actually mining coal, but providing an IoT system based on its own Hongmeng operating system to the mining industry to make mines ‘intelligent’ through ‘digital transformation’.
As Huawei is still a large company, with $71.2b in sales for the 9 months (down from $104.94b last year) they have a better than average chance that over time some of the new businesses can begin to generate sales to offset the smartphone and com business shrinkage, but Huawei does have one advantage in that it is private and does not have the same accountability to shareholders that public companies in the US would have.  That said, while all of said new businesses are based on the company’s move into IoT, developing substantial customer bases in these new markets will take time.  The US has allowed some business between Huawei and US suppliers, but such usually stirs up negative sentiment from China hawks in Congress.  Huawei’s IoT business is not based on leading edge semiconductor processes, which gives them the ability to produce much of the needed silicon on the Mainland, avoiding US restrictions, but we expect there will have to be many more ‘rally’ meetings and speeches before the company is able to see a return to its previous glory.  Reinvention takes time.
0 Comments

Notebooks – Musical Chairs

11/4/2021

0 Comments


Notebooks – Musical Chairs

​As we have noted in a number of recent notes the display industry, particularly the LCD segment, has been leveraging itself toward the production of IT products (notebooks, monitors, and tablets) and away from LCD TV panel production.  Samsung Display (pvt) has sold or shuttered much of its TV panel business, keeping its only large panel production lines open at the request of parent Samsung Electronics (005930.KS), a much more long-term decision made back in 2019, while Chinese brands continue to build out large panel capacity, with a near-term push toward using that and existing capacity to produce more IT panels.  On a m2 basis, smaller panels get a higher ASP so some of the decision to allocate production resources comes from such motivation, but more from relatively mundane global TV demand growth, especially as compared to the increased demand for IT products stimulated by COVID-19.
The recent price decreases seen for TV panels has begun to justify Samsung Display’s original large panel capacity reduction thesis and also helps to justify other panel producers’ decisions to increase capacity exposure to IT products, but along with that decision comes the higher risk toward IT panel pricing.  Until recently that has not been an issue as IT panel prices continued to rise as TV panel prices declined, with continuing demand from brans, but two factors seem to be changing, both of which increase that risk further.  Display driver shortages have been pushing brands to build IT panel inventory.  Fear of a lack of product during the holiday season put brands in the position of paying up to get display module units, with targets based on the strong demand seen over the last year, but over the last two months demand seems to have weakened, first showing up as a slowdown in Chromebook shipments, and then as a broader slowdown in notebook demand. 
There are some technical reasons for this slowdown as students begin to return to classrooms and remote schooling programs wind down, and display drivers have become more available, yet notebook panel shipments have continued to be strong, at least through 3Q.  We expect that some of that 3Q IT order strength came from panel producers filling customer orders that had been delayed due to component shortages or had been under allocation, but hints from panel producers on 3Q calls that indicated a shift toward customers that supply IT products to corporate customers and away from those supplying retail, lead us to see a bit more concern about IT order patterns and there sustainability.
Typically (5 year average) the 4th quarter sees notebook panel shipments decline ~0.3% q/q but we have seen expectations for 4Q notebook panel shipments as low as -1.5%, and while we expect that might represent the extreme, anything significantly above the average would be troubling and would indicate potential notebook panel price weakness.  At just under 34% of large panel quarterly unit volume, weaker notebook panel prices could jeopardize 4Q panel producer sales, especially if TV panel prices continue to decline.  Notebook panel production plans are expected to be up between 15% and 19% in 2022, while recent expectations for notebook demand next year is for less than 1% unit volume growth.  Panel producers always have the option of shifting production to monitors or back to TV panels if prices dictate, but it is beginning to look like a game of musical chairs.
Picture
Notebook Panel Shipments - 2019 -2021 - Source: SCMR LLC, IHS, Witsview, Company Data
Picture
Quarterly Notebook Panel Shipments - 2017 - 2021 - Source: SCMR LLC, IHS, Witsview, Company Data
Picture
Aggregate Notebook Panel Pricing & ROC - 2019 -2021 YTD - Source: SCMR LLC, IHS, Witsview, Company Data
0 Comments

Semiconductor Particle Physics (Not What You Think)

11/4/2021

0 Comments


Semiconductor Particle Physics (Not What You Think)
​

The global semiconductor supply chain has been in a bit of disarray as COVID-19 lifestyle changes rejiggered what we are able to do with our time.  Demand for silicon based products heretofore has outstripped capacity, pushing out lead times and increasing prices to the point where downstream production becomes affected.  The US government has undertaken a 100 day ‘study’ to better understand how this supply chain disruption occurred and how it might be prevented in the future.  As part of the study, the Department of Commerce asked a multitude of semiconductor producers and related companies to fill out a questionnaire as we detailed in our 10/25/21 note.  As the ‘voluntary’ responses are due on November 8, we checked to see what kind of information has been submitted.
Out of the many requests that were sent out, only a small number have been received, and only 13 fall into the ‘available for public viewing’ category, meaning the rest had some type of proprietary information that limited their viewing to government officials.  Some were from private institutions such as the Cornell Nanoscale Science & Technology Facility in Ithaca, which presented 5 paragraphs of general information that looked like it had been copied from an “About us” on the program’s website,  as was the single paragraph from Notre Dame and University of California – Berkley, who actually broke out some information as to technology nodes, semiconductor materials used, and device types produced, as did Northwest Nazarene University (Nampa, Idaho). 
There were a few comments from individuals, one of which came from a Chinese-American individual that was unusual in that it was more of a personal declaration that hinted at governmental control, not by the Chinese government but by the US, which began, “I advertise, market, and promote semiconductors and its applications to solving problems, such as automation and computing. I am a first generation Chinese American, and on many occasions since 2016 people in the United States have been attempting to forcibly separate me from the supply chain. However, my family background and responsibilities are stronger than that, which I continue to promote the use of semiconductors to solve modern world problems.  I have extensive knowledge and experience on the individual use of semiconductors, and I intentionally extend the use of semiconductors to promote its manufacturing and sale in China.”  He goes on a bit further with “I was born and raised in the United States of America. The US or state government and Department of Defense have been pulling my strings since the late 1990s when I was a child. I have been mentored by "ghosts" and "paranormal activity" who have assisted me in providing intelligence and information on problems to solve. These, in turn, revealed more problems that needed to be solved. I have been able to cross-verify my solutions to these problems through movies, television, and other media. Today, being single, unmarried, childless, without a romantic partner continues to motivate my endeavors to challenge the boundaries of the United States and promote the use of semiconductor technology”.  We doubt this is what the study was looking for, but it did call for public comments.
There were a few responses from public companies that left some information in public view.  Tower Semiconductor (TSEM) gave technology node and sales by application, while ASE Technology (3711.TT) in Taiwan kept all but address confidential, and FAIST Anlagenbau Gmbh (pvt), a company that provides noise reduction systems and measurement tools for industrial equipment stated “We only order complete electrical items where semiconductors could possibly be installed” which ended their submission.  While we are not privy to the information submitted under the ‘confidential’ category, there has been considerable consternation among semiconductor supply chain companies, both in the US and globally, as to how much information they would be willing to reveal.  The information request forms sent by the Commerce Department ask for considerable detail (Fig. 1 & Fig. 2), almost all of which would be considered proprietary, which leaves each company to decide whether to comply and with how much information.
We would expect much of the forms will be left blank as this initial request was ‘voluntary’, but the Secretary of Commerce, Gina Raimondo, has stated that “‘I don’t want to have to do anything compulsory but if they don’t comply, then they’ll leave me no choice”, which includes invoking the Defense Production Act, the same act that was invoked to step up the production and distribution of COVID-19 vaccines, although how that might be used is still an open question.  Early meetings between US government officials and semiconductor companies did not answer questions about how much raw and finished semiconductor inventory had been stockpiled by downstream consumers and why allocations from producers changed almost weekly. 
While the semiconductor supply chain is an entity to itself, it’s like particle physics.  We know that sub-atomic particles exist and interact, mostly from the results of those interactions, but we don’t know all of the details as to what goes on at every level.  While the government can ask all the questions it wants, semiconductor supply chain participants are like those sub-atomic particles in that they don’t reveal their secrets easily and require considerable effort to make that happen.  We doubt the US government has the power or willingness to go further and pressure the very companies it is trying to assess, but given the concept that the semiconductor industry is self-correcting over time and the government works quite slowly, it could turn out to be a moot point.
Picture
US Department of Commerce Semiconductor Information Request Form (BIS-2021-0036) - Source: US DOC
Picture
DOC Information Request Form - Customer Information Page - Source: US DOC
0 Comments
<<Previous
Forward>>

    Author

    We publish daily notes to clients.  We archive selected notes here, please contact us at: ​[email protected] for detail or subscription information.

    Archives

    May 2025
    April 2025
    March 2025
    February 2025
    January 2025
    January 2024
    November 2023
    October 2023
    September 2023
    August 2023
    June 2023
    May 2023
    February 2023
    January 2023
    December 2022
    November 2022
    October 2022
    September 2022
    August 2022
    July 2022
    June 2022
    May 2022
    April 2022
    March 2022
    February 2022
    January 2022
    December 2021
    November 2021
    October 2021
    September 2021
    August 2021
    July 2021
    June 2021
    May 2021
    April 2021
    March 2021
    February 2021
    January 2021
    December 2020
    October 2020
    July 2020
    May 2020
    November 2019
    April 2019
    January 2019
    January 2018
    August 2017
    July 2017
    June 2017
    May 2017
    April 2017
    March 2017
    February 2017
    January 2017
    November 2016
    October 2016
    September 2016

    Categories

    All
    5G
    8K
    Aapl
    AI
    AMZN
    AR
    ASML
    Audio
    AUO
    Autonomous Engineering
    Bixby
    Boe
    China Consumer Electronics
    China - Consumer Electronics
    Chinastar
    Chromebooks
    Components
    Connected Home
    Consumer Electronics General
    Consumer Electronics - General
    Corning
    COVID
    Crypto
    Deepfake
    Deepseek
    Display Panels
    DLB
    E-Ink
    E Paper
    E-paper
    Facebook
    Facial Recognition
    Foldables
    Foxconn
    Free Space Optical Communication
    Global Foundries
    GOOG
    Hacking
    Hannstar
    Headphones
    Hisense
    HKC
    Huawei
    Idemitsu Kosan
    Igzo
    Ink Jet Printing
    Innolux
    Japan Display
    JOLED
    LEDs
    Lg Display
    Lg Electronics
    LG Innotek
    LIDAR
    Matter
    Mediatek
    Meta
    Metaverse
    Micro LED
    Micro-LED
    Micro-OLED
    Mini LED
    Misc.
    MmWave
    Monitors
    Nanosys
    NFT
    Notebooks
    Oled
    OpenAI
    QCOM
    QD/OLED
    Quantum Dots
    RFID
    Robotics
    Royole
    Samsung
    Samsung Display
    Samsung Electronics
    Sanan
    Semiconductors
    Sensors
    Sharp
    Shipping
    Smartphones
    Smart Stuff
    SNE
    Software
    Tariffs
    TCL
    Thaad
    Tianma
    TikTok
    TSM
    TV
    Universal Display
    Visionox
    VR
    Wearables
    Xiaomi

    RSS Feed

Site powered by Weebly. Managed by Bluehost