TV Panel Shipments – The Leading Indicator for Consumer Electronics
TV Panel Shipments – The Leading Indicator for Consumer Electronics
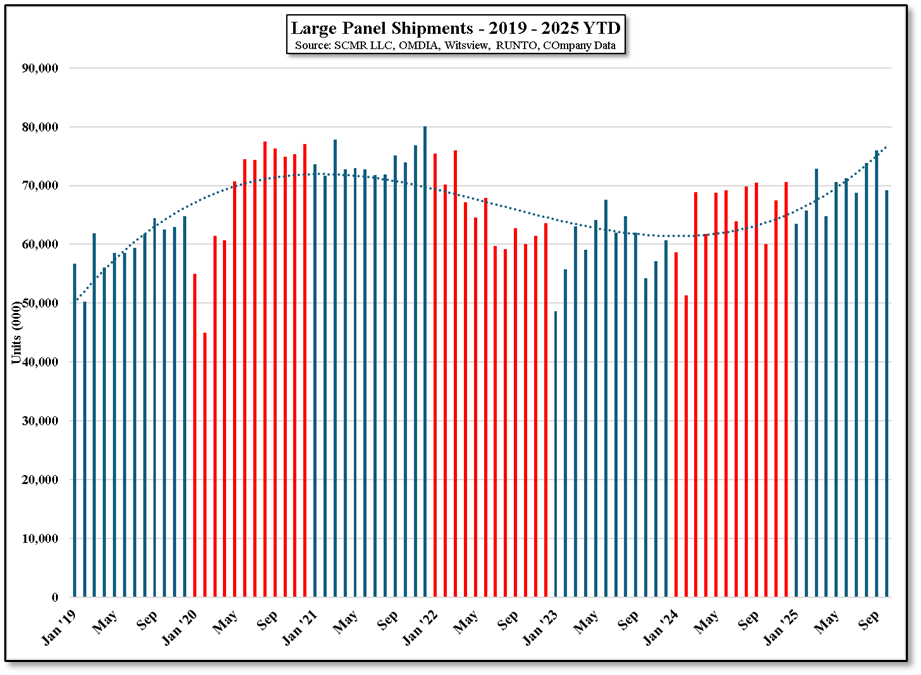
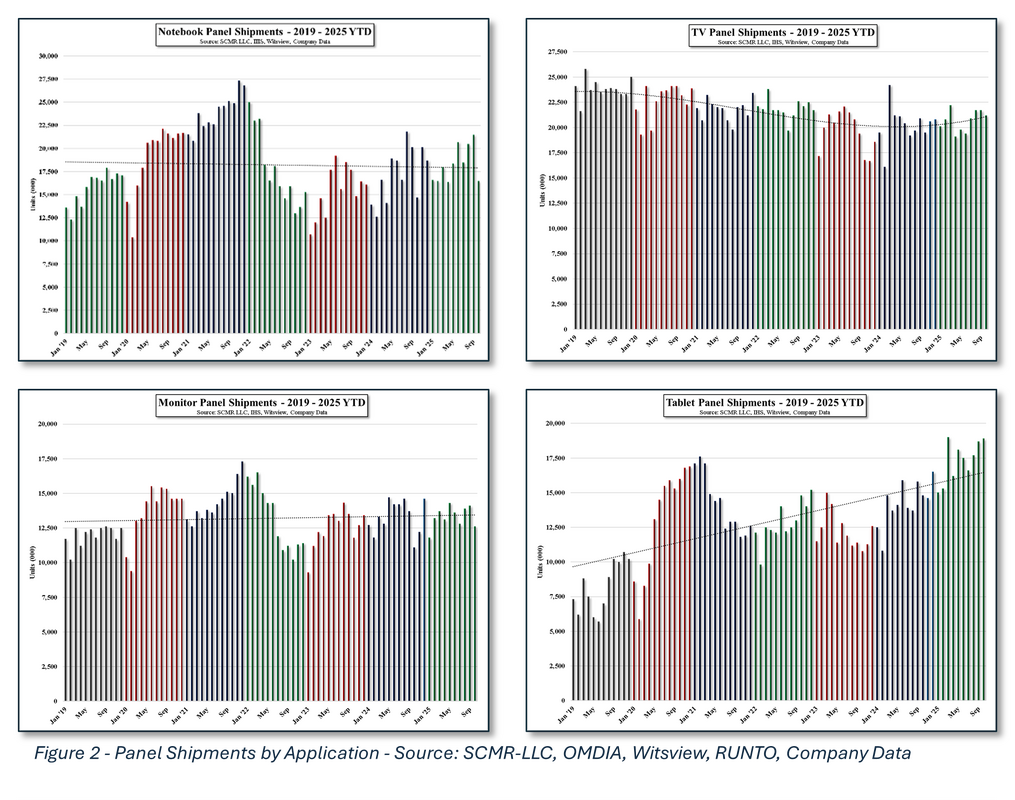
TV panel shipments are among the best indicators of the condition of the consumer electronics space. While there are many CE products, all with their own characteristics, the Tv panel segment is the largest in value and the largest in area. Full year data on panel shipments for 2025 has yet to be compiled (December data being processed), but looking at the 4 major product categories that fall under the large display panel category, here is how TV panels stacked up in 2024[1]
The Global Supply Chain – Upstream fabs to Downstream Brands
Examples of large panel LCD producers:
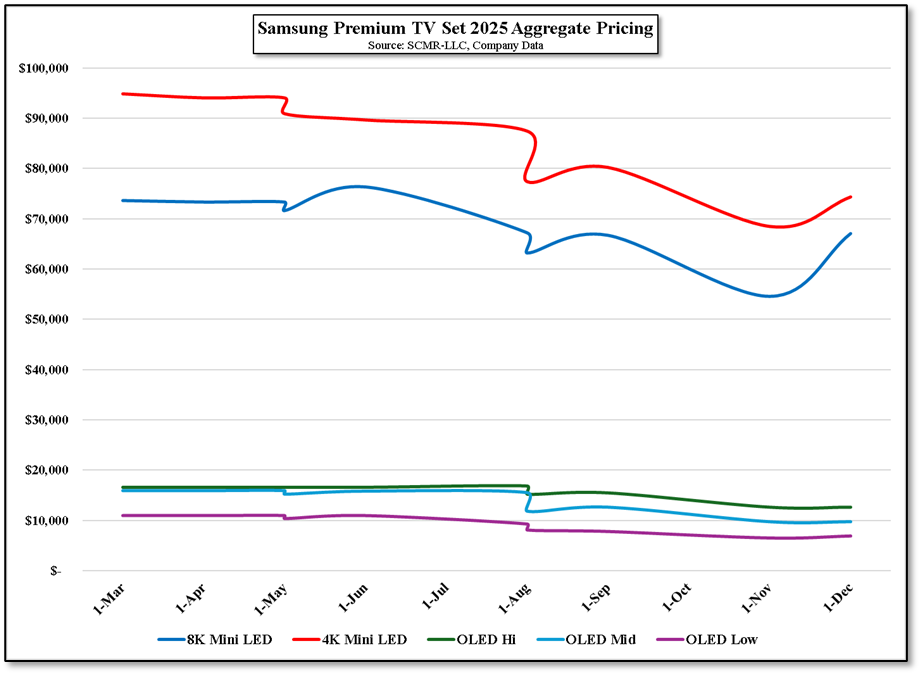
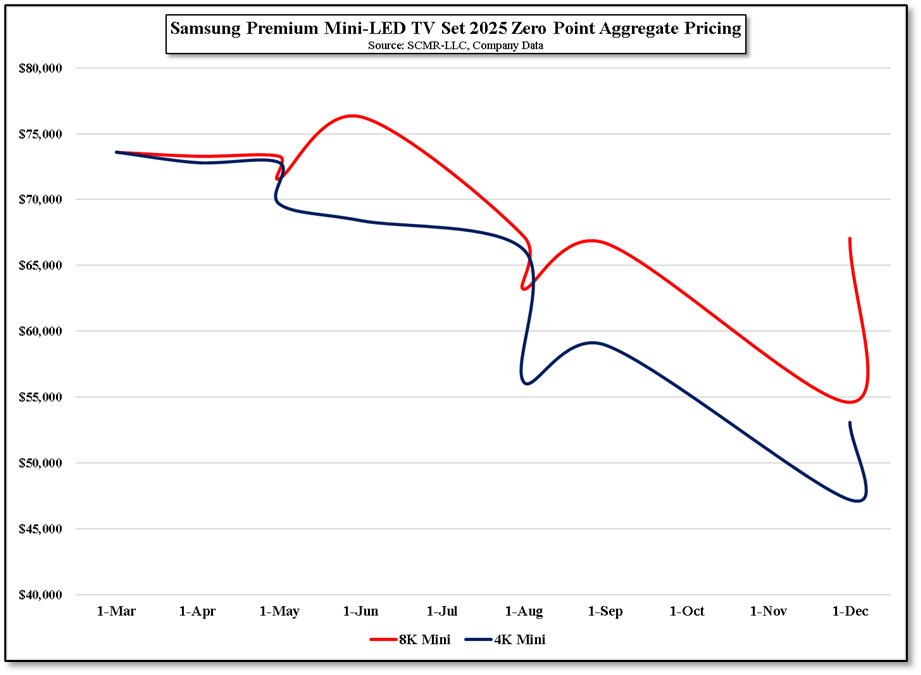
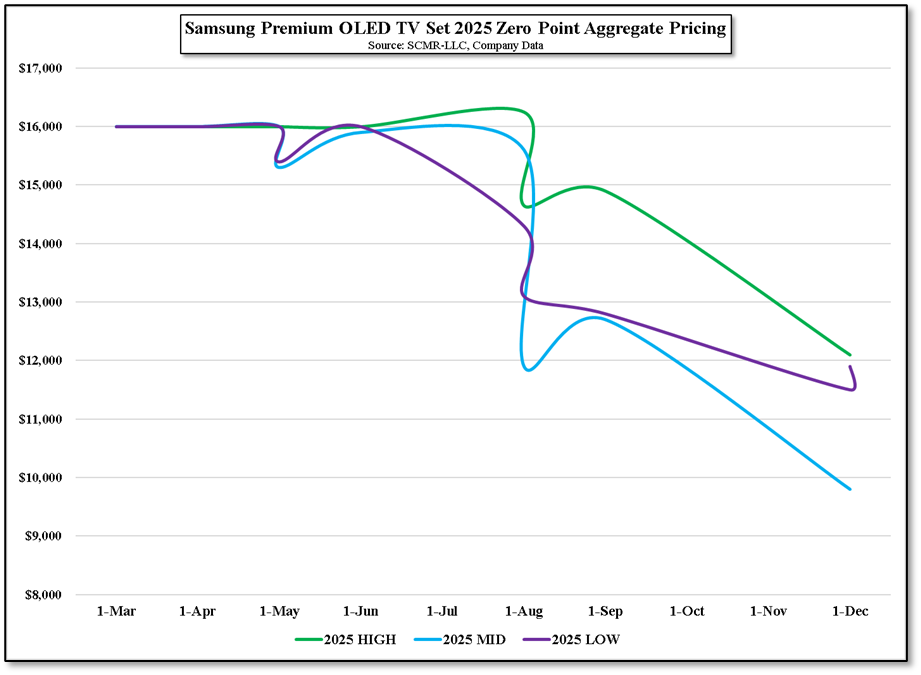
November 2025 Performance: Cumulative YoY Sales Analysis
While monthly y/y sales comparisons are valuable, we see cumulative sales on a y/y basis as more so given the monthly volatility seen in the large panel LCD display space. This comparison shows where the current year (2025 in this case) is relative to the cumulative results for 2024 at the same point in time. In fact, four of the nine large panel LCD producers are in positive territory on a y/y cumulative basis in terms of panel sales value as of December 1, with the monthly leader Chinastar now including the large panel fab it purchased from LG Display in April of 2025, giving it a substantial boost y/y.
[1] Excludes automotive panel shipments
TV panel shipments are among the best indicators of the condition of the consumer electronics space. While there are many CE products, all with their own characteristics, the Tv panel segment is the largest in value and the largest in area. Full year data on panel shipments for 2025 has yet to be compiled (December data being processed), but looking at the 4 major product categories that fall under the large display panel category, here is how TV panels stacked up in 2024[1]
- TV panel shipments represented 31.1% of total large panel unit shipments
- TV panel shipment value represented 55.4% of total large panel value
- TV panel shipments made up ~73% of total large panel area
The Global Supply Chain – Upstream fabs to Downstream Brands
Examples of large panel LCD producers:
- AU Optronics (2409.TT) - Taiwan
- Innolux (3481.TT) - Taiwan
- LG Display (LPL) – South Korea
- Samsung Display (pvt) – South Korea
- Sharp (6753.JP) - Japan
- BOE (200725.CH) - China
- Chinastar (pvt) - China
- HKC (248.HK) - China
- CHOT (600707.CH) – China
- Corning (GLW) – US – Glass substrates/cover
- AGC (5201.JP) – Japan – Glass substrates/cover
- Novatek (3034.TT) – Taiwan - Drivers
- Himax (HIMX) – Taiwan - Drivers
- Nitto Denko (6988.JP) – Japan - Polarizers
- Sumitomo Chemical (4005.JP) – Japan - Polarizers
- Applied Materials (AMAT) – US - Equipment
- Canon Tokki (7751.JP) – Japan - Equipment
- ASML (ASML) – Netherlands - Equipment
- Universal Display (OLED) – US - Materials
- Idemitsu Kosan (5019.JP) – Japan – Materials
November 2025 Performance: Cumulative YoY Sales Analysis
While monthly y/y sales comparisons are valuable, we see cumulative sales on a y/y basis as more so given the monthly volatility seen in the large panel LCD display space. This comparison shows where the current year (2025 in this case) is relative to the cumulative results for 2024 at the same point in time. In fact, four of the nine large panel LCD producers are in positive territory on a y/y cumulative basis in terms of panel sales value as of December 1, with the monthly leader Chinastar now including the large panel fab it purchased from LG Display in April of 2025, giving it a substantial boost y/y.
[1] Excludes automotive panel shipments

Using the same cumulative y/y metric, we can see that unit shipments for the four large panel product categories have remained positive as of November, which indicates that pricing and utilization were the deciding factors as to which producers have performed better than last year (2024) through November:

2026 Industry Outlook: Debunking the Cycle Myths
- Sports Cycle - The CE industry falls back on major sporting events as a selling point for TV sets whenever possible and 2026, with both the Winter Olympics (Italy – 2/6/26) and the World Cup ( US, Mexico, Canada – 6/11/26) this has already been used as a justification for an increase in 2026 TV sets shipments. However, as seen in Figure 1, there is little, if any, correlation between such sporting events and TV set sales over the last 10 years. On a very granular level, monthly and possibly quarterly, there could be somee correlation when it comes to TV sets 65” and larger, but even that relationship tends to even itself out during the remainder of the year. In other words, sporting event purchases tend to be pull forward purchases, rather than a net new purchase or an organic demand increase.
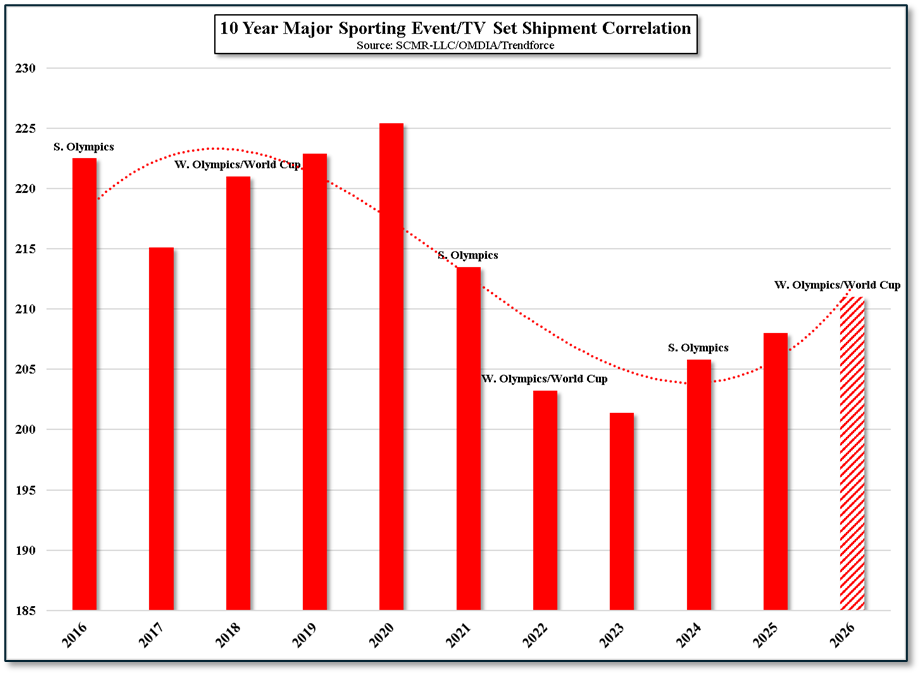
Figure 1 - 10 Year Major Sporting Event/TV Set Shipment Correlation - Source: SCMR-LLC, OMDIA, Trendforce
- Replacement Cycle - There are two trains of thought when it comes to LCD TV replacement cycles. From a technical perspective, in most cases the life of the TV is based on the life of the backlight. Unlike OLED displays, which degrade gradually, LCD backlights tend to be stable, like at or above 95% of original brightness for 5 to7 years of normal usage, typically seeing heat related issues that cause the backlight or power PCBs to fail.
- Size Matters? - Average TV set size is an important factor when it comes to large panel LCD production, but it has little to do with total TV set shipment volume. From the perspective of area, a 2.5” increase in average TV set size, as is predcted for 2026, using 200 million sets/year equals a 4.95% increase in total area produced, the metric that panel producers are most interested in, yet units shipped is not affected by the change.
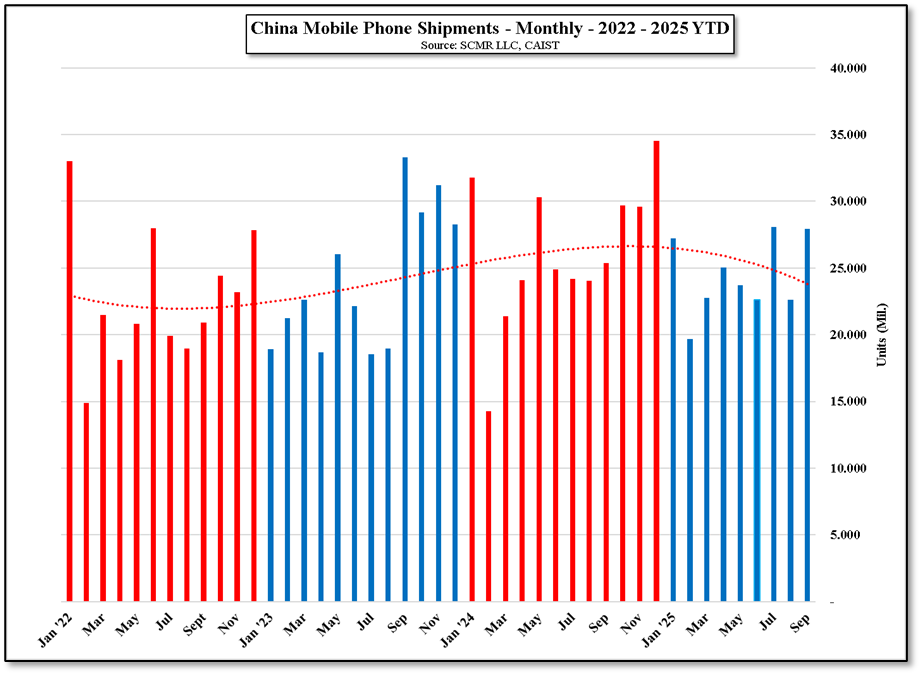
The primary reason we put relatively little credence in these three reasons for an optimistic view of TV set shipments in 2026 is that we have heard them all before, in almost every year when early projections anticipated a year stronger than the last. We do expect them all to have some contribution to TV set shipments in 2026, but we believe that the overall driver for TV set shipments in 2026 will be the economy in the US (The largest TV set market) and China (2nd largest), who combined represent 42.4% of the total global TV set market in terms of units. Current estimates for TV set shipments this year are for ~210 million sets, up ~1.0% y/y, with growth in every region other than China (down between 4% and 5%), so even the optimistic view is for little growth, with Chinese consumer-level subsidies being finished at the end of 2025.
2026 Retail Landscape: Value Brands vs. Tariff Pressures
We believe that while premium TV set models will be the focus during sporting event windows, the average consumer will be more focused on value brands in 2026, especially if we see price increases early in the year as a result of component price increases (memory). Normally this would be beneficial for Chinese brands like TCL and Hisense, but tariffs still play into pricing, giving Korean and Japanese brands a slight advantage. TV set inventory levels remain high going into 2026, leaving retailers to focus more on cost-to-carry than building new stock of 2026 models which would set the tone for a modest 1H. Panel producers in China have a bit of leeway in that they can reduce production during the New Year holiday (Feb 15 – 22) without seeming under pressure to do so, which could help to more closely balance inventory levels to mainland demand. This fits with the new paradigm for Chinese producers of using utilization rather than price as a balancing tool.
Data Modeling: Correlating GDP to NAICS 334 and IPG 3343N
We track a number of GNP sub-sets to better understand the relationships between TV set panel shipments, TV set shipments and the general economy in the US, particularly the NAICS 334 series (Computer & Electronics Manufacturing) and the more detailed IPG 3343N series, known as the ‘Industrial Production Index for Audio & Video Equipment Manufacturing’, which tracks the physical volume of output in a number of CE categories, including TV sets. While it is not the perfect index for TV sets (See index breakdown below) as it incudes a number of other high volume CE products, it is as close as we can come to a viable tracking index for TV sets.
The broad manufacturing sector correlates to GDP at ~0.80, while the 3343 sub-index is more volatile at between 0.65 and 0.75. This means for every 1% shift in real GDP the IPG 3343N index (shown in chart) swings by 2.5% to 3.5% due to the high elasticity of TV sets, essentially, when the economy is strong consumers look to trade up to premium sets, and when it slows, TV sets are among the first CE products to be deferred.
That said there is at least a 3 to 4 month lag between the IPG 3343N index and GDP, with inventory acting as a buffer between the slowdown in GDP and a similar slowdown in factory level production. This implies that due to TV set elasticity, should the GDP miss its 2.1% target and falls to 1.5% growth, the effect on TV set shipments would be pronounced, moving from the 1% unit volume gain to a ~1.5% to 2.1% drop in production for the index. While TVs do not make up the entire index, they will likely see negative growth leading to a slowdown or freeze in shipments
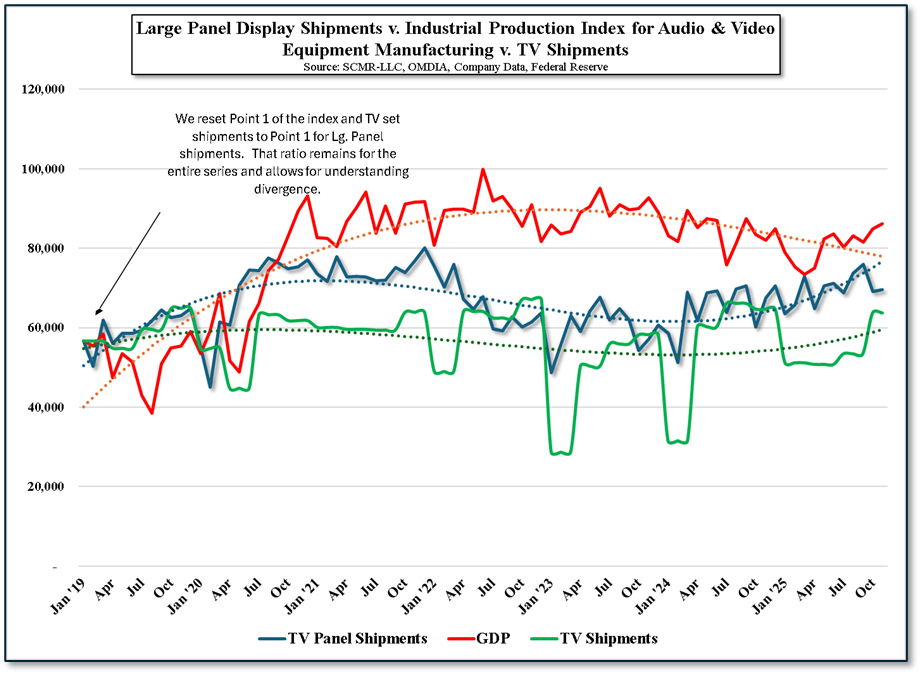
Figure 2 - Large Panel Display Shipments v. Industrial Production Index for Audio & Video Equipment Manufacturing v. TV Shipments - Source: SCMR-LLC, OMDIA, Company Data, Federal Reserve
Conclusion: Economic Vitality as the Sole Arbiter of 2026 Growth
The data for 2025 and projections for 2026 suggest that the television industry has reached a point where traditional "marketing narratives" such as the sports cycle, the replacement cycle, and the trend toward larger panel sizes, no longer function as independent drivers of net shipment growth. Instead, these factors have become secondary effects of a much larger force: the macroeconomic health and consumer confidence of the US and China.
Combined, these two nations represent 42.4% of the global TV market. Because the display industry is a capital-intensive business requiring high fab utilization to maintain profitability, the global supply chain is now hyper-sensitized to the economic shifts in these two specific regions:
FRED Data Breakdown - Series IPG 3343N
Industrial Production Index for Audio & Video Equipment Manufacturing - Physical volume of output
The data for 2025 and projections for 2026 suggest that the television industry has reached a point where traditional "marketing narratives" such as the sports cycle, the replacement cycle, and the trend toward larger panel sizes, no longer function as independent drivers of net shipment growth. Instead, these factors have become secondary effects of a much larger force: the macroeconomic health and consumer confidence of the US and China.
Combined, these two nations represent 42.4% of the global TV market. Because the display industry is a capital-intensive business requiring high fab utilization to maintain profitability, the global supply chain is now hyper-sensitized to the economic shifts in these two specific regions:
- The US Economic Outlook: As the largest market, US consumer spending is the industry's primary base. While events like the 2026 World Cup create high-profile promotional windows, they historically result in "pull-forward" purchases rather than organic market expansion. Growth in 2026 will be dictated by US interest rates, inflation, import tariffs, and the "wealth effect" of the broader economy, which determines if a consumer feels comfortable buying a new set, regardless of whether their old one has reached its technical end-of-life.
- China’s Structural Reset: The projected 4% to 5% decline in China for 2026 is a direct result of economic policy. The expiration of government subsidies at the end of 2025 has re-exposed an underlying weakness in domestic demand. Without new fiscal stimulus or a recovery in the property sector to boost consumer confidence, the Chinese market will remain a drag on global TV set unit volumes, forcing Chinese TV brands to export their excess capacity to other markets or reduce utilization.
FRED Data Breakdown - Series IPG 3343N
Industrial Production Index for Audio & Video Equipment Manufacturing - Physical volume of output
- 40% Speakers, Amplifiers for Musical Instruments
- 25% TV Sets, DVRs, Stereo Equipment
- 15% Audio/Video Equipment for Automobiles
- 10% Microphones & Headphones
- 10% Other (Jukeboxes, Consumer video cameras)


 RSS Feed