Supply Chain Market Research - SCMR LLC
  • Blog
  • Home
  • About us
  • Contact

Fun with Data – Driving Automation

8/9/2021

0 Comments


Fun with Data – Driving Automation
​

SAE, the name for what used to be called the Society for Automotive Engineers, is a well-known standards organization for the automotive space, and while such standards are not legally binding they are widely used across many industries in and around the automotive space.  One area that SAE has set standards for is Driving Automation, an area that falls into the realm of consumer electronics, or at least on the edge.  In May SAE released an update on “SAE Levels”, which it has proposed as the standards for defining levels of automation, which is a topic that will continue to garner attention over the next decade.  While we are not at a point to comment on the validity of the standard and how other countries and organizations might view it, we thought it interesting and educational.
Picture
SAE Driving Automation Chart - Source: SAE.org
0 Comments

5G Ecosystem – July

8/9/2021

0 Comments


5G Ecosystem – July
​

Despite shortages seen in many parts of the CE space, 5G components, at least chipsets for smartphones and other 5G devices, do not seem to have been seriously affected thus far, and continue the trend toward an expanding ecosystem.  July saw the addition of 12 new 5G vendors bringing the total to 143, up from 91 in July 2020, with the number of 5G smartphones also climbing from 431 to 450 during the month versus 162 a year ago.  CPE (Customer Premise Equipment) also grew from 158 to 171 offerings versus 94 at this time last year.
The trend line would indicate that 5G phone offerings would hit 500 by the end of the year, but with that number already at 450 and the holiday season upcoming, we expect that number is low.  Since seasonality data is not relevant considering that 5G data only became available in 2Q 2019, we don’t have a long-term basis for making a forecast for the remainder of the year, but even using a simple average of the monthly 5G smartphone offerings ROC for the last three months would imply a year end number of smartphone offerings of 580. 
While 5G for smartphones has been the focus for most applications, in order for 5G to become widespread, there need to be other devices and applications for those devices to make the technology more ubiquitous. Fig. 4 shows how the share of each application has changed as a percentage of the total, and while smartphones have declined slightly, they still represent 48% of all 5G announced devices.  The data is Fig. 5 however shows the overall growth in announced devices with the data table below indicating the number of units in each category.  Some devices, such as 5G laptops/notebooks have seen very significant growth, albeit with a small number of units, with all categories other than FWA/CPE growing faster than smartphones (see table below).  As there were no in-vehicle 5G applications at the end of last year, that growth rate has been omitted.
All in 5G is growing but aside from the replacement cycle for 4G smartphones, applications that truly benefit from 5G are a real driving force for pushing the technology forward.  IoT applications, particularly mechanical performance data, would certainly benefit from 5G, but would do little to promote the technology where consumers would see its value.  With much of consumer facing 5G promotion oriented toward downloading video or gaming, we see a real market application a bit further out.
 When a multitude of streaming devices for TV are able to access and utilize 5G, meaning when it is available to the consumer, and streaming devices are able to capture a 5G signal either through their own antennae or through a 5G internal Wi-Fi network, we expect a rapid jump in 5G recognition.  This is not a simple task and while some streaming devices can already accept a 5G signal, most Wi-Fi set-ups do not, nor is the service available in many locations.  The bandwidth available in 5G however will give streaming services a shot at removing the buffering and traffic congestion that plagues users.  Downloading a movie to watch in a car is one thing, but not having episode 5 of ‘Loki’ interrupted every 10 minutes would justify 5G for us.
Picture
%G Ecosystem - Primary Indicators - Source: SCMR LLC, GSA.com
Picture
Selected 5G Devices - Device Offerings - Source: SCMR LLC, GMSA.com
Picture
5G Smartphone Unit Volume & ROC - Source: SCMR LLC, GSA.com
Picture
Announced 5G Form Factors - Share 2021 YTD - Source: SCMR LLC, GSA.com
Picture
Announced 5G Form Factors - Units - 2021 YTD - Source: SCMR LLC, GAS.com
Picture
0 Comments

Glass Half Full?

8/9/2021

0 Comments


Glass Half Full?
​

​Taiwan based LCD panel producer Innolux (3481.TT) indicated that while the ongoing chip shortage and a tightening of substrate glass supply would cause the industry to see reduced panel production, they remain cautiously optimistic about the 2nd half.  Innolux management indicated that a glass substrate supplier would be cutting its utilization by 15% to 20% in order to do annual maintenance, tightening what has already been a tight glass market, and would lead to the reduction in panels being produced during the 3rd quarter.  Their take on the 3Q panel squeeze was that the reduction in panel production would reduce supply and avoid a glut, although the company had not mentioned that an oversupply situation was a possibility in the past.  Singling out IT products as the area where there was an imbalance between supply and demand, they indicated that the reduction should ease those concerns.
As we have noted a number of times in the past, LCD panel producers have been shifting production away from large panels (TV), where demand has weakened, and moved to IT products, meaning monitors, notebooks, and tablets.  While logic holds that panel producers would follow those areas with the highest profit potential, capacity has increased relatively quickly while demand has stayed relatively flat, especially if one accounts for the potential component shortages that have limited deliveries or pushed out dates.  This has caused buyers to ‘enhance’ ordering a bit by increasing numbers to encourage allocations and meet quotas despite possible shortages.  As brand inventories get closer to real quotas, those orders become more realistic and panel producers are left with excess capacity, a situation they have not faced in over a year. 
The TV panel space is already seeing some panel price weakness, however the IT space, where the capacity shift has been the greatest, has seen only less aggressive panel price increases and has yet to see real panel price declines.  While the annual maintenance period during August is not unusual for glass producers, given the tight market and the high level of production at all of the glass producers that maintenance cannot be avoided and some shortages above the recent norm might be seen, but we have a hard time seeing this scenario as a glass half full one, rather than one indicating the potential for change., But then we are not sitting on billions of dollars’ worth of capital equipment that needs to be running at or near full capacity to produce profits.  Just a difference in perspective.
0 Comments

Early August Panel Prices

8/6/2021

0 Comments


Early August Panel Prices
​

There has been some cautionary talk among some in the display supply chain about the possibility that the rapid panel price increases seen over the last year might slow or even decline over the next few months.  Those in that camp cite component shortages, double ordering, and COVID-19 outbreaks as the root cause, while the rest of the industry nods quietly during such discussions but indicates that those factors have not affected their business and expectations remain unchanged.  While we do not expect the outlook for panel prices to fall off a cliff, we do expect less panel price increase momentum as we have stated previously.
Our expectations for August panel prices indicate that IT products, primarily notebooks and monitors, will continue to see upward panel price movement, but TV panel prices, depending on size, will see some price declines.  Since we aggregate panel prices, both from a number of sources and by size, the overall panel price movement can belie the fact that some panel sizes can see price increase while the aggregate price is negative.  This is a normal occurrence in many panel categories, however it become consequential when there is a change in momentum, as we believe is currently afoot.   In the TV space, smaller TV panel (32” to 55”) prices are expected to decline, while larger (65” and above) are expected to rise, as the consumer’s quest for larger TVs continues, while smaller TVs, more common in developing markets, are more easily produced and are offered by a large number of panel producers.
As to the real reasoning behind this change in panel pricing perspective, while component shortages can limit panel output, the underlying demand is the true driver for panel pricing, and while demand for IT products remains relatively strong currently, TV demand has been weakening as the COVID-19 vaccines have begun to ease concerns about venturing outside and away from a TV screen.  Right now this is an iffy proposition, as the ebb and flow of COVID-19 can push sentiment in one direction or another, but the general focus, at least in most developed countries is that life is, at the least, trying to return to normal, which helps to break the bonds of TV binging. 
Notebooks still have yet to see demand slow, although some of the county-wide educational programs that have created such demand are beginning to tail off as students begin to repopulate classrooms.  We expect this will be the last display category to tail off, as the results of bringing students back to classrooms won’t be known until September or October, but monitors, for which demand has also remained strong, would be the segment that we expect could see some weakness over the next few months, with returning office workers offsetting some of the weaker stay-at-home demand.
From the supply side, while we expect capacity utilization to remain relatively high as we enter the seasonal build period, we have seen a more enthusiastic view of capacity additions from a number of panel producers in recent months.  Whether this is a result of being profitable for the last few quarters or a continuing need to dominate a particular display category, we do not know, and most of the proposed capacity increases, at least in the LCD space, are relatively small, or have been underway for more than a year. 
That said, while the capacity issue is certainly one we watch closely, the fact that most large panel producers have been shifting capacity away from TV panel production and increasing their IT panel output.  This is a logical move as IT panel demand remains visible while TV demand is less so.  IT panel products also tend to be more profitable on a per m2 basis, and the model variety is greater than the TV space, leading to a bit less head-to-head price competition and more specialized feature selection which leads to higher prices, but the shift toward IT panel production also carries significant risk when IT panel prices begin to weaken and utilization rates begin to decline.  We expect that IT panel buyers, who have been on the wrong side of the bargaining table for a year, will push to regain their negotiating leverage and panel producers will respond by quickly lowering prices.
None of this will happen in an instant, especially as we are entering the seasonal build period when panel demand is typically highest, but both panel and component price increases that have become almost normal across the CE space also add to that risk as consumers are less in need of immediate gratification and more willing to wait for more reasonable device prices.  Panel producers will not panic even when they see some order cancellations or cut backs, but when they are unable to fill that open capacity with new orders they will start making deals to keep fab utilization from falling.  They have yet to face that situation, but it is more of a ‘when’ than an ‘if’ situation in our view.
Picture
Picture
Aggregate Panel Price Rate of Change - 2019 - 2021 YTD - Source: SCMR LLC, IHS, Trendforce, OMDIA, Company Data
0 Comments

Samsung Mini-LED/QD Set Pricing…Again

8/6/2021

0 Comments


Samsung Mini-LED/QD Set Pricing…Again
​

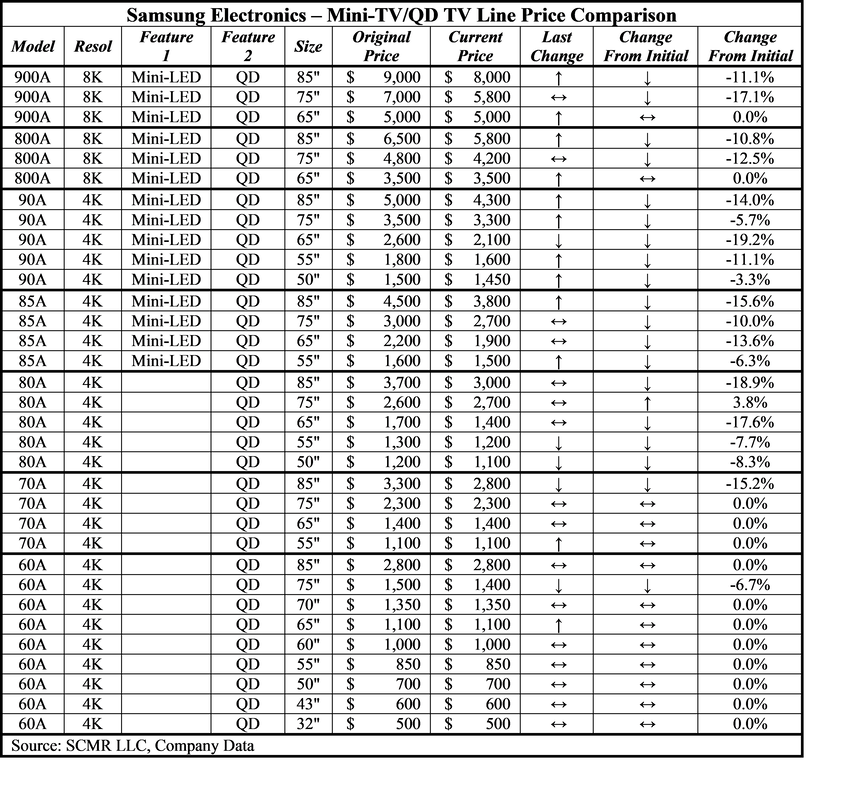
OK, we admit it, we are a bit obsessed with Samsung Electronics’ (005930.KS) recent release of its first Mini-LED/Quantum Dot TV line.  Its not that we like or dislike the technology or the sets themselves, but we are fascinated with Samsung’s set pricing, which we have been closely tracking since their release in late May.  What makes this interesting is two-fold.  First, Samsung had little or no reference point for pricing such sets as at the time of their release only Chinese brand TCL (000100.CH) had produced commercial TVs using this technology and those sets had limited availability on a global basis.  Second, Samsung has been ‘adjusting’ the prices on its Mini-LED/QD TVs and even their QD TVs quite often, some in reaction to the recent release of its own Mini-LED/QD TVs by rival LG Electronics (066570.KS).  We believe Samsung is hunting both to find a price point where consumers will be willing to try the new technology (Mini-LED) or will tolerate some of the price increases that are being built into existing LCD quantum dot TVs as a result of higher panel and component prices.
The data that we have collected suggests that Samsung hit the lowest aggregate price point for their Mini-LED/QD line between June 2 and June 25 and has been maintaining or raising prices on the majority of sets since then.  That said, of the 15 models in the Mini-LED/QD TV line, only two models remain at their original prices, with the remaining 13 models are still lower than their initial prices, despite the recent set price increases.  The average price decline from initial prices for the Mini-LED/QD models is now 10.0%, with the range from 0% to -19.2%.  Among Samsung’s ‘plain’ quantum dot TVs, meaning those with QDs but no Mini-LEDs,  only one of the 18 models in that category has a higher price than at release, while 11 have seen no change.  The average decline is 3.9% for this category.  The table below shows recent price changes and the result relative to original prices.
Picture
0 Comments

Universal Display – Part 1

8/6/2021

0 Comments


Universal Display – Part 1
​

Never a dull moment for those involved in Universal Display (OLED), the primary supplier of OLED emissive materials.  After reporting 2Q sales results that were essentially in line with consensus and EPS $0.02 below consensus, the stock opened down 6.5% and has continued to decline at the time of this writing.  Noting that the stock has a 52 week range between $161.01 and $262.77 and that the company has beat expectations in each of the last four quarters, we understand that investors are fearful that there has been some major change in the company’s business or the OLED display space, but believe that such thinking comes from a lack of understanding of the display space and the OLED space in particular.
As always with Universal Display, there are number of moving parts that can affect quarterly numbers and the company reminds investors regularly that such factors can disconnect quarterly results from industry trends, but on a longer-term basis, which is the proper way to look at the OLED display space, we believe the trends tend to coincide.  This has been even more apparent since the advent of accounting rule ASC 606, which tied royalty and license revenue recognition to material sales for long-term contracts and reduced some of the wide swings in royalty and license revenue seen before the rule was put in place.
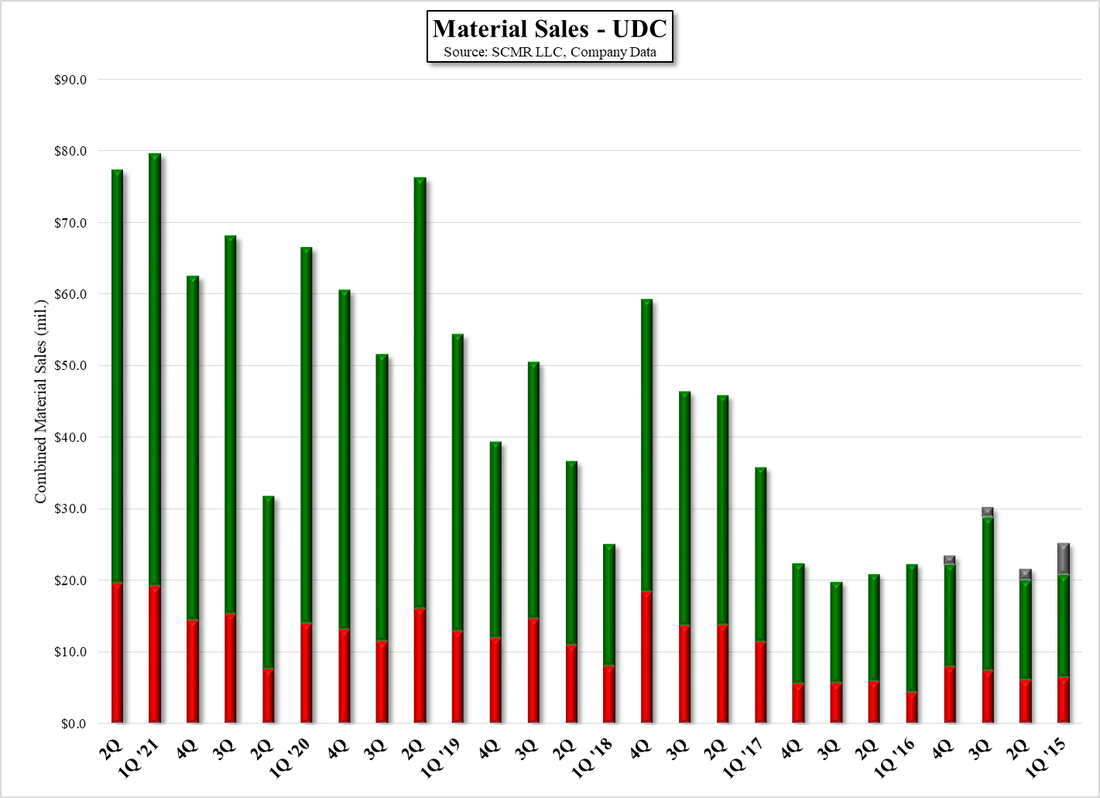
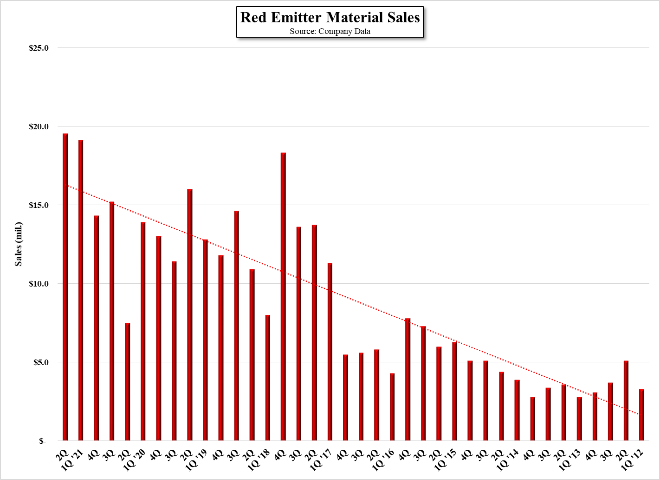
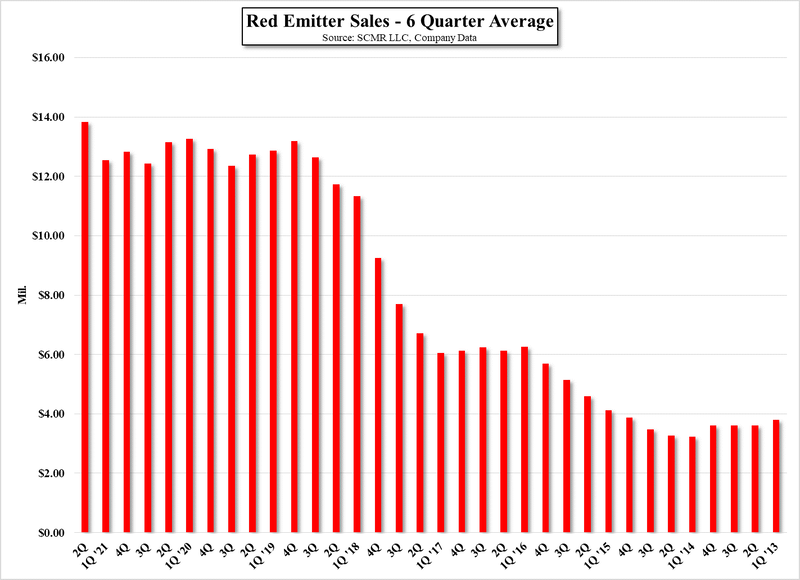
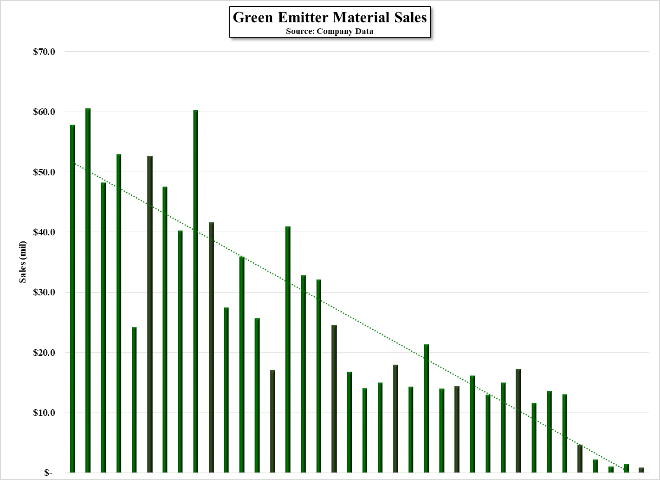
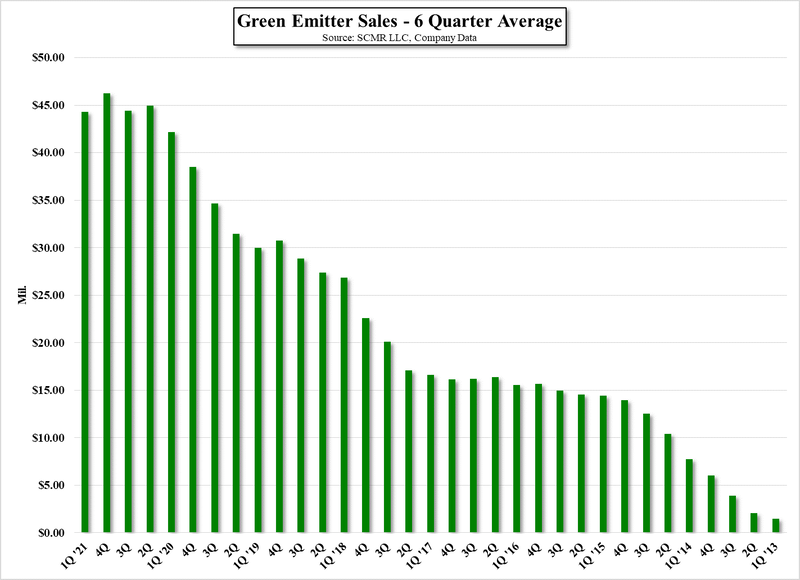
UDC reported material sales of $77.4m, down 3.0% q/q and up 123.7% y/y, although the y/y comparison, as with many display companies, is against a very weak quarter last year during the onset of COVID-19.  Material sales overall have been growing, as seen in Fig. 1, with the last two quarters above the long-term trend line.  Even breaking down the material sales into the two primary components, red emitter and green (includes yellow/green used by LG Display (LPL)), both remain above the trend lines.   Red OLED emitter is a component of all RGB OLED devices, which would include OLED smartphones, OLED tablets, and OLED notebooks and monitors, so again on a long-term basis, the growth of red emitter material would be linked to the growth of those products.  Green and green/yellow OLED material is used both in the same RGB displays indicated above, and is the primary emitter component of OLED TVs, so it is a bit harder to break out the growth of green OLED material as to product category.
Further complicating the breakdown of UDC’s sales is the fact that the regional breakdown, which in the past tied in closely with South Korean customers Samsung Display (pvt) and LG Display, became distorted when LG Display began producing OLED TV displays at it fab in Guangzhou, China, as those sales fall in with Chinese OLED producers and become harder to isolate.  This situation makes disaggregating UDC’s short-term sales considerably more difficult, and should push investors to rely less on quarterly results and more on yearly results, but that is not the world we live in, so UDC’s shares retain the volatility that trading parameters dictate rather than long-term growth.
There are two positive factors that will affect UDC’s long-term growth in material sales and license/royalty income.  The first is capacity growth, which is simply the timeline for OLED expansion and Greenfield OLED fab projects.  As we focus on projects that are either underway or have passed the early planning stage, we see OLED capacity growing as indicated in the table below.  This implies that out years will not include projects until they have been confirmed, so while we model beyond 2022, we expect 2023 and beyond to change considerably going forward.  Chinese OLED suppliers, such as BOE (200725.CH), Tianma (000050.Ch), and Visionox (002367.CH) are operating OLED production fabs, but relative to South Korean producers, are still in the relatively early stages of product development and full scale mass production.   China is determined to unseat South Korean OLED panel producers from their dominant position in the global market, and as they did in the LCD space, they will continue to expand production until they can capture significant share, which bodes well for the capacity that will further stimulate UDC’s sales. 
The other positive factor is panel size increase, which we have noted previously, and as LG Display continues to expand its OLED TV offerings by increasing panel size and adding capacity and the small panel OLED market, which has been primarily focused on smartphones, is beginning to expand into notebook and monitor panels, which will begin to absorb OLED capacity over the next few years.  With the penetration rate of OLED displays in smartphones nearing 50%, much of the incremental OLED capacity that will be added over the next few years will be dedicated to that market, but as these new OLED application grow, it will push the need for incremental capacity to feed these applications.  In fact there has been speculation that Samsung Display is considering refitting an idle LCD Gen 8.5 fab to produce OLED IT products, and while such plans are not yet in our model, they would be incremental to what is shown in the table below.
Of course there are offsets, particularly the desire by OLED panel producers to reduce the cost of OLED production, a portion of which could be based on replacing current OLED emitters with more efficient ones, and while UDC works toward these same goals for their customers, in theory such more efficient materials could result in smaller quantities being needed to produce the same results. This has been and remains an issue for some investors, who look at any quarterly decrease in material sales as validation that OLED producers are becoming more efficient, both wasting less emitter material and developing ways of using less to achieve the same results.  This is something UDC has been grappling with since its inception, but misses two points. 
First, one of the comparisons that LCD panel producers use against OLED displays is brightness, with LCD displays the brighter option.  OLED panel producers have found a number of ways to improve the brightness of OLED displays, but improving the OLED device’s ability to generate a brighter display is primarily a function of the materials in the OLED stack, so a more efficient material, meaning one that can convert more energy into light, would certainly get the attention of panel producers as they would be better able to compete against other display technologies 
Second, UDC’s OLED material contracts with producers are based on material volumes, which trigger set points at which the cost of the material to the purchaser declines.  Once that volume reaches a ‘terminal’ point, the price remains at the lowest level for the life of that OLED stack.  If UDC is able to generate a new OLED emitter composition that has better characteristics that the previous material, customers will switch, which resets the price table to its highest point, improving material margins.  This incentivizes UDC to produce new and more efficient OLED emitters to attract its customer base toward these premium products, and while that is counterintuitive to some, it is the basis for UDC’s ability to generate material margins in the 65% to 75% range.  While this quarter’s material margins were 67%, after 1Q’s 74%, we see this as a relatively short-term move similar to material cost increases seen by many others in the display space, and we expect a return to higher material margins over the next few quarters.
While the ups and downs of UDC’s shares are vitally important to some investors, we find many are principally focused on quarterly results that can boost performance, but looking at the OLED industry from the perspective of overall growth is a far better way to capture that growth without the distraction of overinflated or underinflated expectations.  We will continue to delve further into Universal Display next week, with more data for those that are interested in how UDC plays into the display space and the growth of the OLED segment.
Picture
Picture
Material Sales - UDC - Source: SCMR LLC, Company Data
Figure 2 - Red Emitter Sales - Source: SCMR LLC, Company Data           Figure 3 - Red Emitter Sales (Smoothed) - Source: SCMR LLC, Company Data; ​Figure 4 - Green Emitter Sales - Source: SCMR LLC, Company Data  Figure 5 - Green Material Sales (Smoothed) - Source: SCMR LLC, Company Data

0 Comments

Air Tag Tussle

8/5/2021

0 Comments


Air Tag Tussle
​

​Apple’s  Air Tags are typically used to monitor the location of personal devices, such as cell phones, tablets, laptops, keys, or even luggage, but a Portland lawyer put them to use in an unusual way, and made an unusual discovery.  Michael Fuller, a lawyer who fought for the homeless in and around Portland, had a notion that city contactors who were charged with clearing the tents of the homeless camps in the area, were violating the law by throwing away such items.  Under local law,  on unsanitary items and those with no apparent use could be thrown away, while all others must be stored in a warehouse for at least 30 days.
Getting a bit of advanced information about a potential site clearing, he attached Air Tags to 16 items and tracked their locations after the site was cleared.  As it turned out a number of the items would up in a recycling transfer station rather than the warehouse.    What makes this unusual is that based on the Air Tag system, those workers who had been  carrying their iPhones during the process were likely the one’s who helped track the items as the system identifies tagged items when any iPhone gets nearby.  Since this is done anonymously, the city contractors did not know they were revealing their own shortcomings and validating the claims of the homeless, who had seen personal items leave the tents but not appear in the warehouse.  While turning off your iPhone will keep it from identifying any of your own nefarious deeds, but all it will take is someone wandering near the tag to reveal its location to the network, so turning off your iPhone when stealing packages from neighbor’s porches could lead to a day in court.
0 Comments

Fun With Data – More China Smartphones

8/5/2021

0 Comments


Fun With Data – More China Smartphones
​

We know that 2Q was not a good one for smartphone shipments in China, with overall shipments down 22.3% q/q and down 26.9% y/y, with a big sales spurt in April of 2020 making the y/y comparison look even worse.  That said, the incremental data for 2Q this year confirms that it was a weak quarter, not only for Huawei (pvt), which was expected, but for all other major brands on the Mainland.  While Huawei did not even enter the top 5 brands in 2Q this year, against a 44.5% share in 2Q last year,  even Vivo (pvt) the share leader in 2Q ’21, saw its shipments drop 15.1% q/q, although it still saw a 23.5% y/y gain.  As Huawei fell into the ‘other’ category this quarter, we cannot break out their share or comparisons, but the table below points to how the other top brands fared during 2Q this year.
The gains shown in share from top brands in China obviously come at the expense of Huawei, formerly the share leader, and while we know the ‘other’ category saw a large q/q and y/y increase in 2Q due to the inclusion of Huawei’s shipments, it also included those from spin-off brand, Honor (pvt) that fell out of the top five list in 2Q, although we believe Honor saw a 40.8% q/q increase in shipments against a weak 1Q, and a -46.3% y/y comparison against last year’s spectacular 2Q.
Picture
0 Comments

Innolux LT Deal for Large TV Panels

8/5/2021

0 Comments


Innolux LT Deal for Large TV Panels
​

Innolux (3481.TT) announced that it had signed a long-term supply deal with Sakai Display Products (pvt), the company that owns the formerly Sharp (6753.JP) Gen 10.5 LCD fab in Japan.  Innolux will pre-pay in installments, the $618m price of the 12 year deal through its subsidiary Foshan Optoelectronics (pvt).  Behind the concept of the deal is eliminating the cost of building a greenfield Gen 10.5 fab, which would likely cost between $1.9b and $3.3b for each 30,000 sheet/month line, of which there would likely be two.  Innolux currently runs one Gen 7.5 and two Gen 8 LCD fabs, with the Gen 7.5 fab most efficient at producing panels in the 42” to 46” range, and the Gen 8 fabs most efficient producing 55” panels, with TV panels representing 38% of Innolux’s 2Q sales.  However, as consumers look toward larger size TVs, the Innolux fabs become far less efficient at sizes of 65” and larger.  This has pushed Innolux to decide whether it would be more cost effective to build its own Gen 10.5 fab or sign a deal with Sakai Display, who runs a Gen 10.5 fab that has been in operation since 2009.
The decision is made a bit more obvious due to the fact that Sakai Display Products is owned by Terry Gou, the Chairman of Hon Hai (2317.TT aka Foxconn (2354.TT)), with the company owning a controlling stake in both Sharp and Innolux, so the deal is sort of an ‘all-in-the-family’ one that benefits all parties to some degree and Terry Gou in quite a few of them.  Sakai is expected to increase its capacity from 90,000 sheets/month to 120,000 and eventually to 150,000, but no timetable has been given and Foxconn has a long history of making promises and not fulfilling them, so we maintain our model at current capacity until we get confirmation that new lines have been added and are operating.  If such an expansion does become a reality will Mr. Gou provide the financing or will the capital be drawn from some other related entity?
Picture
Flags - Source: Bloomberg
0 Comments

Samsung Reviewing Its Mobile Business

8/5/2021

0 Comments


Samsung Reviewing Its Mobile Business
​

​While Samsung’s (005930.KS) Vice-Chairman Lee Jae-yong’s legal team is pushing for the courts to release the billionaire from his 2.5 year prison sentence by placing him on parole, the company’s current management has continued a special review of the company’s mobile unit in light of weak results from the company’s flagship Galaxy S21, which was released in late January this year.  Typically, Samsung Galaxy S series smartphones sold over 30m units, while last year’s Galaxy S20 sold between 23m and 27m units and this year’s series is thought to have sold a bit over 13m units, which has burdened Samsung’s ability to meet its smartphones sales targets this year.
Also under review in the mobile division are Samsung’s 5G smartphone sales, which have fallen behind Apple (AAPL), and Chinese brands Vivo and Oppo (pvt), despite Samsung’s early lead in the category.  Samsung’s  mobile supply chain is also in question, as shortages of certain components have the potential to limit smartphone sales, and the company’s relationship with application processor supplier Mediatek (2454.TT) has soured as Samsung’s leverage with the company dwindled along with smartphone sales.  According to our data Mediatek processors have appeared in only one Samsung model this year, while in six models in both 2020 and 2019.
Samsung officials declined to comment on the review, but added that each business unit can conduct their own review without top management being involved, however we believe this review is being done by Samsung’s Business Support Task Force, the organization that was formed in 2017 to replace the Future Strategy Office when Lee Jay-yong was originally jailed, as that group had been accused of orchestrating the bribery scandal that jailed the vice-Chairman and led to the impeachment of the then President of South Korea. 
0 Comments
<<Previous
Forward>>

    Author

    We publish daily notes to clients.  We archive selected notes here, please contact us at: ​[email protected] for detail or subscription information.

    Archives

    May 2025
    April 2025
    March 2025
    February 2025
    January 2025
    January 2024
    November 2023
    October 2023
    September 2023
    August 2023
    June 2023
    May 2023
    February 2023
    January 2023
    December 2022
    November 2022
    October 2022
    September 2022
    August 2022
    July 2022
    June 2022
    May 2022
    April 2022
    March 2022
    February 2022
    January 2022
    December 2021
    November 2021
    October 2021
    September 2021
    August 2021
    July 2021
    June 2021
    May 2021
    April 2021
    March 2021
    February 2021
    January 2021
    December 2020
    October 2020
    July 2020
    May 2020
    November 2019
    April 2019
    January 2019
    January 2018
    August 2017
    July 2017
    June 2017
    May 2017
    April 2017
    March 2017
    February 2017
    January 2017
    November 2016
    October 2016
    September 2016

    Categories

    All
    5G
    8K
    Aapl
    AI
    AMZN
    AR
    ASML
    Audio
    AUO
    Autonomous Engineering
    Bixby
    Boe
    China Consumer Electronics
    China - Consumer Electronics
    Chinastar
    Chromebooks
    Components
    Connected Home
    Consumer Electronics General
    Consumer Electronics - General
    Corning
    COVID
    Crypto
    Deepfake
    Deepseek
    Display Panels
    DLB
    E-Ink
    E Paper
    E-paper
    Facebook
    Facial Recognition
    Foldables
    Foxconn
    Free Space Optical Communication
    Global Foundries
    GOOG
    Hacking
    Hannstar
    Headphones
    Hisense
    HKC
    Huawei
    Idemitsu Kosan
    Igzo
    Ink Jet Printing
    Innolux
    Japan Display
    JOLED
    LEDs
    Lg Display
    Lg Electronics
    LG Innotek
    LIDAR
    Matter
    Mediatek
    Meta
    Metaverse
    Micro LED
    Micro-LED
    Micro-OLED
    Mini LED
    Misc.
    MmWave
    Monitors
    Nanosys
    NFT
    Notebooks
    Oled
    OpenAI
    QCOM
    QD/OLED
    Quantum Dots
    RFID
    Robotics
    Royole
    Samsung
    Samsung Display
    Samsung Electronics
    Sanan
    Semiconductors
    Sensors
    Sharp
    Shipping
    Smartphones
    Smart Stuff
    SNE
    Software
    Tariffs
    TCL
    Thaad
    Tianma
    TikTok
    TSM
    TV
    Universal Display
    Visionox
    VR
    Wearables
    Xiaomi

    RSS Feed

Site powered by Weebly. Managed by Bluehost