October Panel Pricing
Display panel pricing, for the most part was flat for the month of October, with TV panel pricing the only category that saw movement (↓2.1% m/m), albeit within our forecast range. Our November forecast is almost identical to October, with a bit of an increase on TV panel downward pressure and less on mobile panel pricing. We show both October pricing and forecast for each panel category below and also show October Y/Y and an additional metric that shows cumulative prices y/y, indicating how much better or worse the year is at this point relative to last year.


As we have noted previously, panel producers, particularly Chinese panel producers who control the LCD panel market, have been taking a different path this year. Rather than letting panel prices fall to improve demand when buyers hold back orders, they are lowering utilization rates. This has created a more stable pricing environment for IT panels (Monitors, Notebooks, Tablets) but has not worked as well for TV panels where TV brand buyers have faced considerable uncertainty concerning holiday demand. Panel producers have lowered utilization rates temporarily in October but are hoping that brands will pull in some early 2026 orders before year in order to take advantage of lower TV panel prices. Some of that optimism comes from the upcoming 11/11 holiday in China, although the most recent holiday sparked little incremental demand, and the knowledge that the Winter Olympics will take place in early February. However thus far brands have been holding out orders, assuming that TV panel prices will continue to fall.
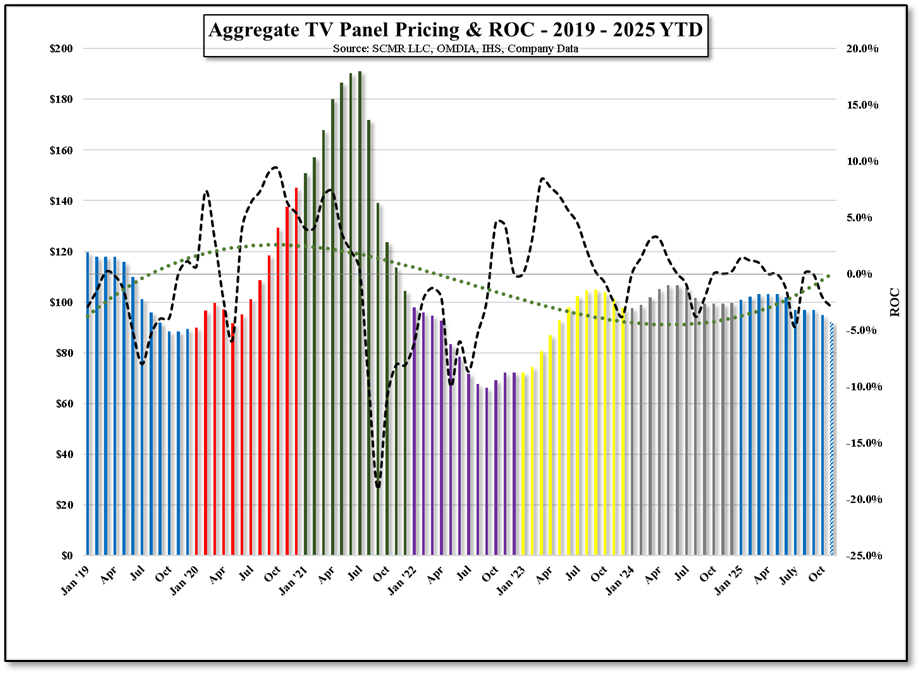
Figure 1 - Aggregate TV Panel Pricing & ROC - 2019 - 2025 YTD - Source: SCMR-LLC, OMDIA, IHS, Company Data
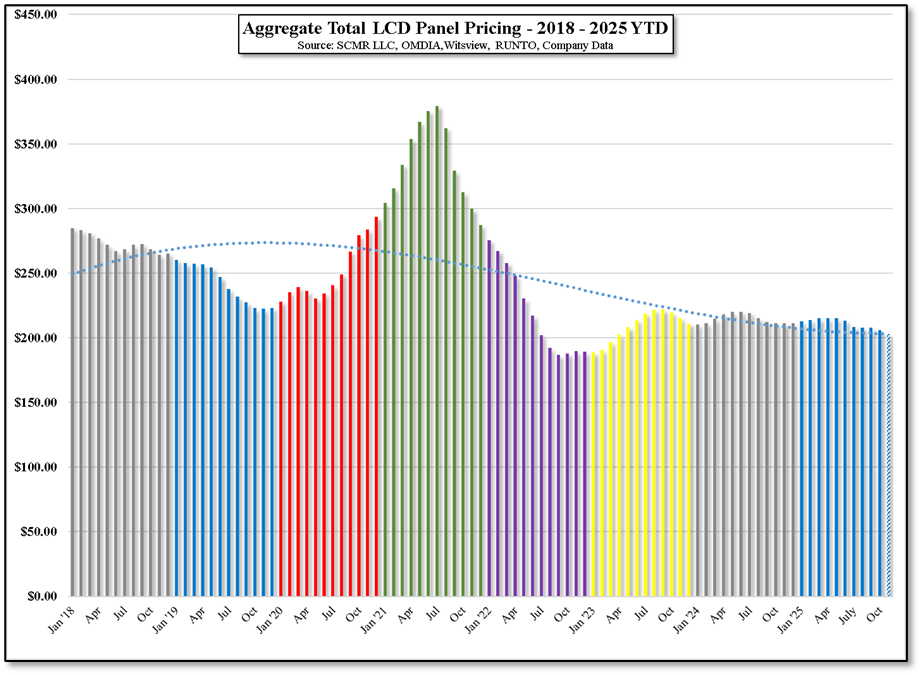
Figure 2 - Aggregate Total LCD Panel Pricing - 2018 -2025 YTD - Source: SCMR-LLC, OMDIA, Witsview, RUNTO, Company Data


 RSS Feed