Supply Chain Market Research - SCMR LLC
  • Blog
  • Home
  • About us
  • Contact

Fun With Data - E-Paper in China

1/16/2025

0 Comments


Fun With Data - E-Paper in China

The e-paper market is an exclusive one as the basic electrophoretic display technology behind most e-paper displays is based on IP owned by E-Ink Holdings (8069.TT), with that company’s subsidiary also producing e-paper film.  E-ink has partnered with or licensed the technology to a large number of companies who use the displays in consumer products, such as e-readers, or commercial products such as ESLs (Electronic Shelf Labels) or signage.  While this technology has very different characteristics than LCD or OLED displays, it also has some characteristics that make it ideal for certain circumstances, particularly where power consumption is a significant consideration.
E-paper displays reflect light rather than generate it as LCD or OLED displays do, which allows them to be used in high-brightness environments (sunlight), but this also limits their use in dark environments.  However, the most significant characteristic of e-paper displays is their power usage.  LCD and OLED displays are active devices in that in order to operate, every pixel needs to be electronically ‘refreshed’ many times each second.  While this allows for rapid changes and smooth image movements, it requires constant power, either from a battery or a line source, regardless of the information being displayed.  E-paper displays only draw power when the image is changing, which means static images, such as the price of an item in a store, do note draw power, and therefore would allow a battery to last far longer than an active display, especially in situations where there is little or no change in what the display shows.
An obvious example of an effective use of e-paper is the e-reader, made popular by Amazon’s (AMZN) Kindle and the Barnes & Noble (BNED) Nook, with Amazon still the leader in the e-book space, followed by Kobo (4755.JP) and others.  While e-readers are popular on a global basis, that market has developed slowly in China, both because of the intense focus on smartphones as indicated by the many Chinese smartphone brands, but also a cultural preference for physical books over electronic readers, although that seems to be changing.
China’s e-paper tablet market (online) generated sales of 1.834m units last year, a small number compared to the country’s population and the ~290m smartphones that were sold on the mainland last year, but that number was up 49.1% y/y and far exceeded expectations (1.56m units), and online e-reader unit volume increased by 34.4% to 834k.  The two other main segments of the Chinese e-paper tablet market, smart office books and smart learning books also grew, up 21.1% and 199.3% respectively.   That said, both the e-reader and smart office tablet segments saw sales down as prices for those devices declined, while sales in the e-paper educational tablet segment grew 18.5% y/y, making it the largest category (42.8%) in terms of sales.
The major Chinese e-paper tablet brands also saw significant growth last year, with the top 5 brands generating 89.3% of sales for the category, up 11.9% from the previous year, and as can be seen in the table below, generated significant improvement in y/y sales.  The number of new e-paper tablet products released in China last year also increased, but we believe the most significant change in the Chinese e-paper market is color.
Picture
0 Comments

Perspective

1/16/2025

0 Comments


Perspective
​

​Large TV sets bring visuals closer to life size and therefore make them more realistic, and, as LCD display manufacturing matures, the ability of producers to increase screen size continues to grow.  While the average screen size across the broad spectrum of TV sets is only a bit above 50”, LCD panel manufacturing has advanced quite significantly from the mid-1980’s when 9” – 10” LCD TV screens were the standard and 30” demos were the talk of the industry.  We have now reached a point where consumer TV sets are almost life-size, with the largest LCD (Mini-LED/Quantum Dot) TV being 115” on the diagonal[1] , the TCL (000100.CH) 115X955.  This 216 lb. behemoth stands 56.4” high, 101” wide and 2.2” thick, with a screen area of 5,651 in2, enough room to fit 345 iPhone 16’s or four 55” TVs within its confines, with a little room left over.  In human terms, the set’s height is roughly that of a 10-year-old child.
Unfortunately, the production of such a large display is extremely inefficient, utilizing only 62% of a Gen 8.6 substrate and 41% of a Gen 10 substrate, although multi-modal fabs, those that are able to cut more than one size panel per sheet, would be more efficient. Yield is also a big issue, as the sunk cost of a defective panel of this size, even at an early stage in the production process, is extremely high.  That said, this TV set has 20,736 zones in its backlight, allowing precise backlight control for every 0.27 in2 of screen area, along with all the bells and whistles that one would expect in a high-end TV.
This all comes at the exceptionally low price of only $20,000 (or 24 easy payments of $833.34 if you make the purchase with your new Best Buy (BBY)/Visa (V) credit card), unless you are one of those who only wants the latest technology.  In that case there is the Samsung (005930.KS) 114” Micro-LED TV, but that will set you back a mere $150,000 (those 24 easy payments will now be $6,250 each), although both sets are 2024 models if that matters to you.  The real issue here is that if you are willing to accept a slightly smaller TV set size (98” to 100”) and a direct lit (No Mini-LED but with Quantum Dots) backlight, you can grab the Hisense (600060.CH) (100QD7N) 100” TV for $2,000, and if you are willing to go down to 98”, you can save another $200 with the TCL 98Q651G for $1,800.  
So while there is still a very big premium for the top of the TV set size triangle, the fact that the competition between the four LCD panel producers that are currently producing LCD panels 98” or larger is extremely intense, as is the competition between TV set brands for high-end customers, causing the price of these very large TVs to continue to decline.  If one times their purchase around Black Friday or after new model announcements, you too can be the talk of the neighborhood.  Your kids will be popular, you will have friends dropping by every time there is a big game, and only a few of the old-timers will say, “Ah, who needs it?  We had a 10” set in the 50s and we loved it!”


[1] There are larger modular Micro-LED sets but they tend to be custom built.
0 Comments

The Dance of Death?

1/16/2025

0 Comments


The Dance of Death?
​

The US government’s ban on TikTok (pvt) has resulted in a high-stakes poker game that involves the US Supreme Court, the incoming President, one of the largest companies in China, and at the tail end of the chain, lots of US citizens.  The Chinese company ByteDance (pvt) has said that if the US Supreme Court does not intervene, it will shut down the TikTok app in the US on Sunday, January 19, with some foreign commentary stating that “Americans may face unemployment and plummeting incomes, and the US new economy will collapse overnight” if the shutdown occurs.  Underlying those radical statements comes the concept that 5 million small and medium sized US businesses use TikTok to promote their products.
We doubt the potential ban of TikTok would presume financial collapse in the US and ByteDance has already (Since early 2023) cloned TikTok with Lemon8. While its user base is only a small fraction of that of TikTok, TikTok influencers have been pointing to the Lemon8 app as the ‘place to go’ if TikTok is shut down.  Unfortunately, as ByteDance is the owner of Lemon8, it could fall pray to the same US regulations that are causing the TikTok issues, but as it has not been explicitly named, it might be able to either dance around the rules or wind up in the maelstrom of courtroom battles for years.
President Trump holds the cards currently, as he has the potential to use an executive order to postpone the potential ban and is adept at using the courts to cause things to grind to a halt if he so desires, so if it seems that the ban might leave a stain on the early days of the new administration, the odds are that a compromise will be reached and the US economy and its cadre of TikTok users will not permanently be denied an endless supply of videos about pretty much anything.  The three most popular on TikTok now are “Laura B. Healthy promoting a good breakfast and her relationship with Nature’s Bounty”, a very nice guy cutting the lawn for a very old lady (for free), and a promotion for Saturday Night Live.  If being unable to view those collapses the US economy our economic system is a bit flawed.
Picture
Figure 1 - Danse Macabre - Multiple artists - 1463 - Lubeck, Germany - Source: Atlas Obscura
0 Comments

More “New for Old” Data

1/15/2025

0 Comments


More “New for Old” Data
​

​The Chinese “New for OLED” subsidy program for home appliances that began in August of alst year has been a success, at least according to the Ministry of Commerce, who stated that as of 12/19/24, 33.3m Chinese consumers had purchased more than 52.1m home appliances, and the funds used for those subsidies was greater for the home appliance segment than it was for the automotive segment.  This would indicate that consumers are more highly focused on using the subsidies for low-cost, low-cost of ownership items than for high-visibility, high-cost items.
0 Comments

TV Data Dance

1/15/2025

0 Comments


TV Data Dance
​

There are many sources of shipment information for smartphones, PCs, tablets, and other CE devices, but data on TV set shipments is lacking.  Obviously, the data on a brand basis is confidential, but conversations with brands can sometimes pull in nuance that helps to make TV set estimates and forecasting a bit less seat-of-the-pants.  On a general basis TV set shipment data is less accurate than other major CE categories and estimates made by large data collectors is usually well protected from the public eye unless you are a subscriber.  We do see research reports on TV set shipments and sales from a variety of companies that specialize in writing industry specific reports, but they tend to be formulaic and offer little insight or detail into how their data was derived or what it means.
Without being able to subscribe to every service that provides TV set shipment data, we have always collected snippets of information that are part of press releases,  quarterly calls, Ks & Qs, and conversations with suppliers, along with the hard data that is occasionally allowed out into the world of non-paying users.  In particular, we try to collect enough hard quarterly data to compile what we call an ‘aggregated’ estimate for TV set shipments, based on no less than 3 sources (usually more), from which we can derive an average and a deviation to both reduce the effect of outlier estimates (average) and to test the confidence levels of estimates across a quarter (deviation).
Having worked years ago for one such aggregator/consultant, we understand how data on CE products is collected and what goes into formulating the estimates that are so heavily relied upon by the media and businesses.  That said, we also know the non-data influences that go into those estimates, and, depending on the firm and the analysts, the potential intensity of their effect on the results.
 With all of that said, as an adjunct to the hard data that we do collect, we are currently building a model that will take into account not only the hard data, but will try to quantify the influence of a variety of other factors and arrive at a hard near-term estimate and a longer-term directional prediction that takes into consideration some macro factors, and a few litmus tests on certain more emotionally driven factors that are subjective and carry less weight, but do have an influence on results and can help to predict DOT (Direction Over Time).  We note also that we will be using AI, not to perform calculations or for writing assistance, but to help to gather sentiment information.  We hope to have the model function effectively by mid-year and will continue to put together the aggregated data we always have in the interim.
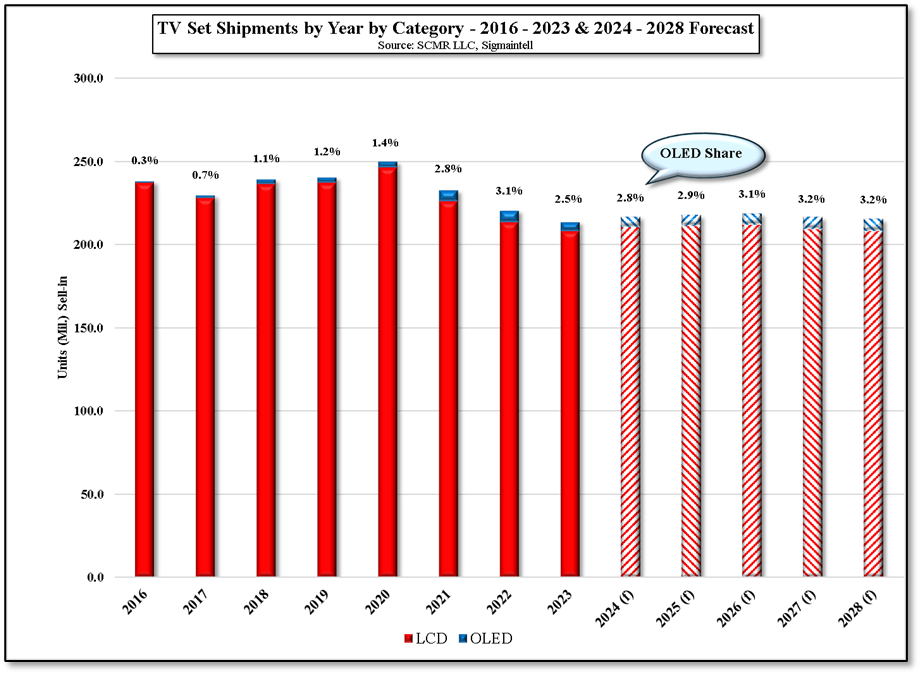
In that regard, we were fortunate to be able to access estimates for TV set shipments from one particular source that includes both historic (from 2016) and forward-looking (2028) TV set shipment estimates, and while we are showing them here, we note that these are single source estimates, not our usual aggregated estimates.  The reason we show them is because they are an updated and complete set for the years 2016 to 2028, essentially 13 years without missing data.  While the totals are most important, the data also breaks down the TV set category between LCD TV and OLED TV, making it easy to visualize the relative size of the OLED share.
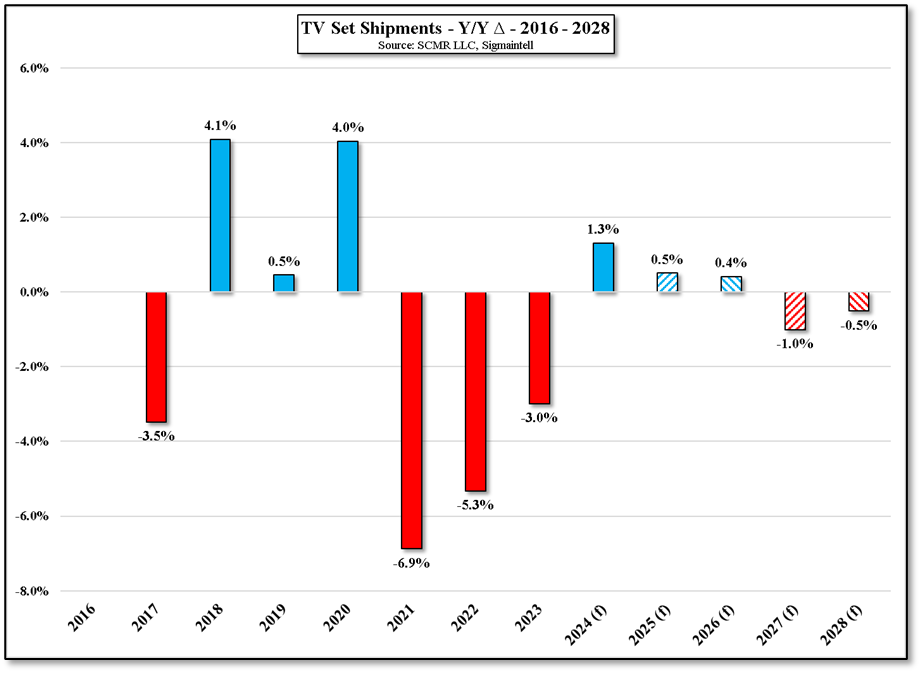
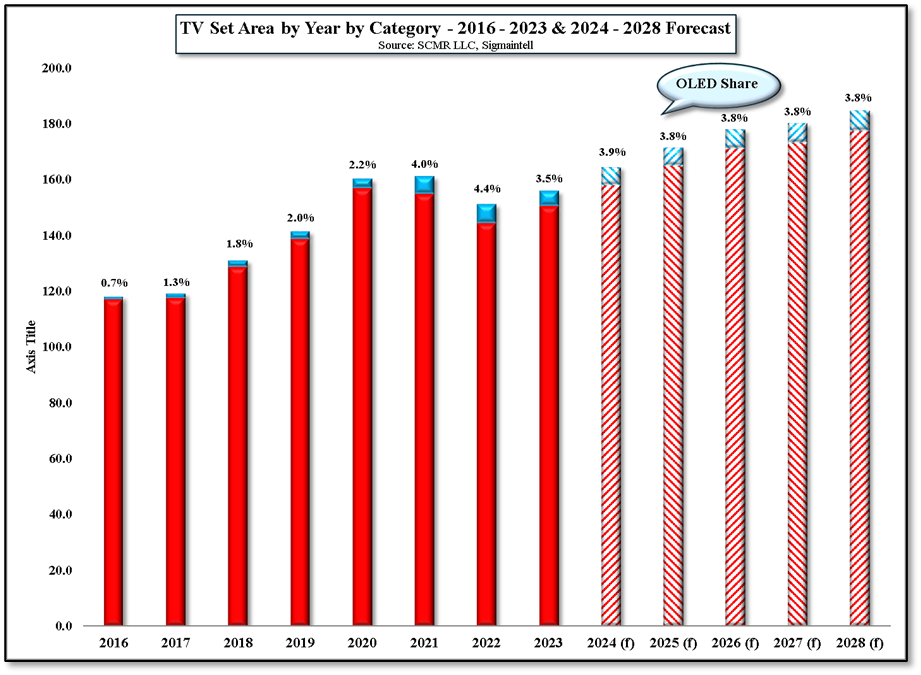
Again noting that this is single-source data, it can be seen that TV shipments have been on a general decline since 2020, a rather steep decline that ended in 2024 with a modest increase in TV set shipments, followed by expectations for almost flat shipments for this year and next, and declines into the out years.  TVs are no longer the communication hubs they have been in the past, now competing directly with smartphones, leaving TVs as more of an entertainment function as its preferred venue, which make unit growth difficult outside of larger screen sizes.  In terms of TV set shipments, in either the 2016 – 2024 or the 2016 – 2028 timeframes, the CAGR is negative.  As noted, TV set size has been a positive for the segment with 5.4% growth in TV set area in 2024, although area growth, while positive, is expected to see progressively less growth through 2028.  The area CAGR for the 2016 – 2024 period is 3.8% and is 3.3% for the extended period.
All in, the TV set business now has roots in share growth rather than unit or area growth, and that leads to a highly competitive environment.  AI, a potential draw for smartphones and laptops, is not as visible to consumers with TV sets as it is with other devices that can access generative AI, although AI-based imaging applications are of great benefit to TVs, even if the average consumer has no interaction with their function and notices little difference.  That leaves size and price as the magnets to draw in consumers and there are certainly limits for both, but we do expect the Chinese LCD display machine to keep pushing the average TV set size higher as they squeeze out the costs of 100”+ sets over the next 2 years.  That said, we keep our expectations for shipment growth low over the same period.
Picture
Figure 1 - TV Set Shipments by Year by Category - 2016 - 2023 & 2023 - 2028 Forecasts -Source: SCMR LLC,Sigmaintell
Picture
Figure 2 - TV Set Shipments Y/Y ROC - 2016 - 2028 - Source: SCMR LLC, Sigmaintell
Picture
Figure 3 - TV Set Area by Year by Category - 2016 - 2023 & 2024 - 2028 Forcasts - Source: SCMR LLC, Sigmaintell
0 Comments

Body Snatchers

1/15/2025

0 Comments


Body Snatchers
​

AI systems are always searching for data and with more models being trained on similar or the same basic datasets, the search for ‘fresh data’ is of great importance to model builders.  As we have previously noted, the quality of model training data has considerable consequence in keeping the model from becoming ‘uncreative’ and losing its ability to generalize when it sees new or previously unseen data.  As we have also noted, model builders use the internet to harvest data by sending out bots to scrape data from websites that seem to have ‘fresh’ data that would help to keep the training data from becoming stale.
This is not a problem for large sites, but it can become a serious problem for small ones, as the bots are inherently impatient, some making tens of thousands of server requests to try to download information from the site quickly.  This can overload the server, which was not designed for such high-volume traffic and can crash the site.  Further, the bots use a large number of IP addresses, which keeps them under the radar of those systems that look for high volume requests from a single IP address.  In theory such bots are not supposed to crawl sites that have a paywall and are not supposed to collect any data that would allow for the tracking of personal identities.  A simple file on the website called Robots.txt tells bots what they can and cannot look at on the site or  can limit their access based on their IP.  That said, it is imperative for that file to be correctly configured, even if there are warnings about scraping the site in other places, or the bots will scrape everything on the site.
Here's the example (real):
A small company with only seven employees has spent 10 years building a database of 3D image files it has scanned from human models (with their permission).  These are 3D files and images of hands, feet, and other body parts, all the way to full body scans.  They sell these images, which can include a variety of facial expressions or movements, with over 65,000pages of content, each with at least three images per page.  They sell these images to 3D artists, game developers, or anyone who needs images with real human features.
Picture
Figure 4 - Sample page - Source: Triplegangers
Unfortunately a recent visit to the site by OpenAI’s (pvt) GPTBots sent tens of thousands of server requests in order to download the entire content of the site.  As the site requires payment to download its content, the bot should not have been able to make those requests, but it did and it crashed the site, which also had a Robots.txt file and a clear Code of Conduct and Terms of Use that strictly forbid scraping.  With the bot using different IP addresses for each request, it seems to the security software that they are coming from multiple users, and the only way to figure out how to block those and other crawlers is to spend days working through each server request to confirm its legitimacy.  In the meanwhile, the site was down, potentially the rights of the human models have been violated, and the site will receive a huge bill from Amazon (AMZN) for the massive server surge that the bot caused.  To make it worse they still have not found a way to get OpenAI to delete the material, other than sending an official request.
As it turns out, most small sites don’t know that they have been scraped as some bots are more subtle in making content requests to the server.  If they don’t cause a server overload, the only way one would know that there proprietary data was scraped would be by manually searching through pages of server logs, something small sites just don’t have the time to do.  So while there are ‘good’ bots that observe rules and keep themselves under control, there are ‘bad’ bots that just hammer away at sites and can cause the damage indicated above.  It is almost impossible to guard against the wide variety of crawlers that are developed almost daily and the very aggressive needs for ‘fresh data’, so small sites remain at risk to this AI menace  This was a real case of bodysnatching…
Picture
Figure 5 - Bodysnatchers - Source: https://mymacabreroadtrip.com/
0 Comments

Will AI Cause the End of Social Media?

1/14/2025

0 Comments


Will AI Cause the End of Social Media?
​

We have written a number of times about deepfakes, those seemingly real images created by AI systems.  They are, at the least, annoying, but also erode what confidence in social media’s ‘validity’ that currently exists.  If you cannot believe what you see, then why bother to look, especially as Ai systems improve their ability to create even more accurate images. There will always be those who don’t care if the image is real, as long as it provides a few moments of entertainment, and perhaps generates some focus on those who circulate them, but while deepfakes are a problem, and a difficult one to solve, there is a bigger one.
In order for models to increase their accuracy, they need more examples.  This could mean more examples of text from famous authors, more annotated images of gazebos, dogs, ships, flagpoles, or more examples of even more specific data, such as court cases or company financial information.  Current Large Language Models (LLM) are trained on textual and code datasets that contain trillions of words, but the constantly expanding sum total of human text is loosely estimated in the quadrillions, so even a massive training dataset would represent less than a 10th of a percent of the corpus of human text.  It would seem that the chance that model builders will run out of data for training models would be something of concern far in the future, but that is not the case.
Models are now able to scrap information from the internet, which is eventually added to its training data when fine-tuned or updated.  The next iteration of the model is trained recursively, using the previous models’ expanded dataset, so Model V.2 generates output based on model V.1’s original training data and what it found on the internet.  Model V.3 uses model V.2’s expanded dataset, including what it finds on the internet to derive its own output, with subsequent models continuing that process.  This means that while model V.1 was originally trained on ‘reality, adding data from the internet, which we might loosely call ‘mostly realistic’ taints that models output slightly, say from ‘realistic’ to ‘almost completely realistic’.  Model V.2’s input is now ‘almost completely realistic’ but its output is ‘mostly realistic’ and with that input for the next iteration, model V3, its output is ‘somewhat realistic’.
Of course these are illustrations of the concept, but they do represent the degenerative process that can occur when models are trained on ‘polluted’ data, particularly data created by other models.  The result is model collapse, which can happen relatively quickly as the model loses information about the distribution of its own information over time.  Google (GOOG) and other model builders have noted the risk and have tried to limit the source of internet articles and data to more trustworthy sources, although that is a subjective classification, but as the scale of LLMs continues to increase the need for more training data will inevitably lead to the inclusion of data generated from other models and some of that data will come without provenance.
There is the possibility that the AI community will coordinate efforts to certify the data being used for training, or the data being scraped from the internet, and will share that information.  But at least at this point in the Ai cycle, model builders cannot even agree what data needs to be licensed and what does not, so it would seem that adding internet data will only hasten the degradation of LLM model effectiveness.
How does this affect social media?  It doesn’t.  Social media has a low common denominator.  The point of social media is not to inform and educate, it is to entertain and communicate, so there will always be a large community of social media users that don’t care whether what they see on social media is accurate or even real, as long as it can capture attention for some finite period of time and possibly generate status for the information provider, regardless of its accuracy.  Case in point the ‘Child under the Rubble’ photo we showed recently or the image of the Pentagon on Fire that was circulated months ago, both of which were deepfakes.
 In fact, we believe it is easier to spot deepfakes than it might be to spot inaccuracies or incorrect information from textual LLMs, as specific subject knowledge would be required for each LLM output statement.  It is a scary thought that while the industry predicts that model accuracy will continue to improve until models have the ability to far surpass human response accuracy, there is the potential that models will slowly (or rapidly) begin to lose sight of the hard data on which they were originally trained as it becomes polluted with less accurate and less realistic data; sort of similar to the old grade school game of telephone.  If that is the case, social media will continue but the value of LLMs will diminish.
 
Picture
Figure 5 - The Telephone Game - Source: Normal Rockwell
0 Comments

Biting the Bullet

1/14/2025

0 Comments


Biting the Bullet
​

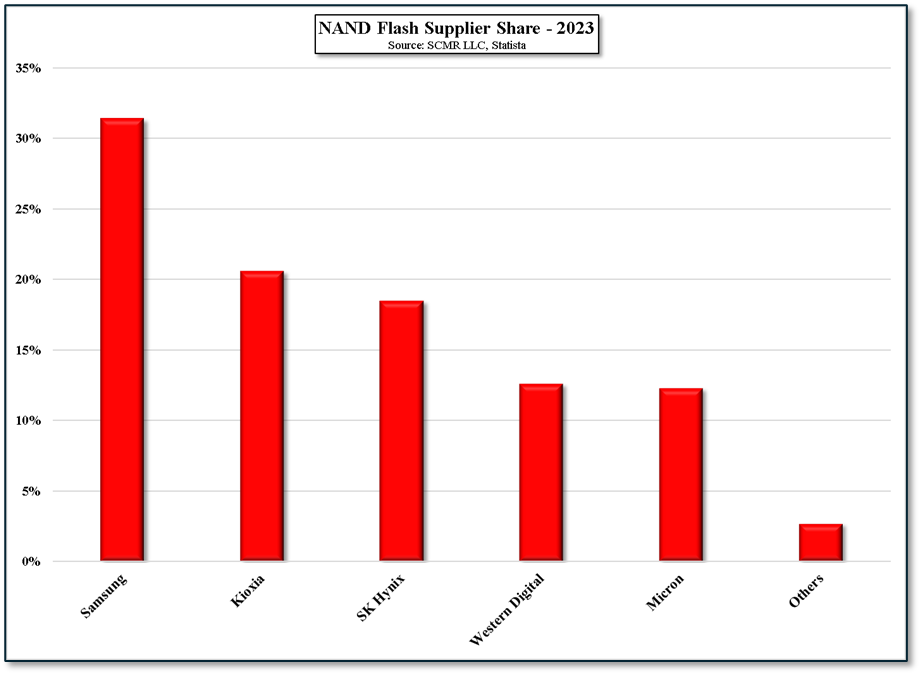
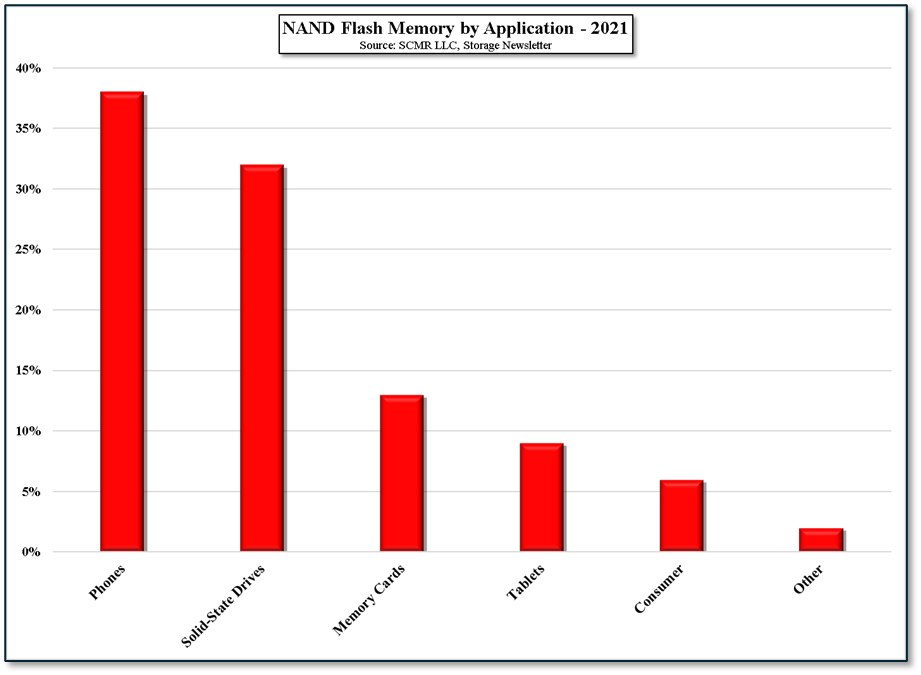
NAND Flash is an essential memory product used in a variety of consumer and enterprise products, particularly smartphones and Solid-State Drives.  It is comprised primarily of MOSFET Transistors that trap electrons within the gate of the transistor.  The presence or absence of electrons indicates a 0 or 1, and while RAM (Random Access Memory) is short-term storage, NAND is considered long-term storage and will hold its gate state without power, making them ideal of Solid State Drives.  There are only a few NAND flash producers, with Samsung Electronics (005930.KS) the leader for many years.
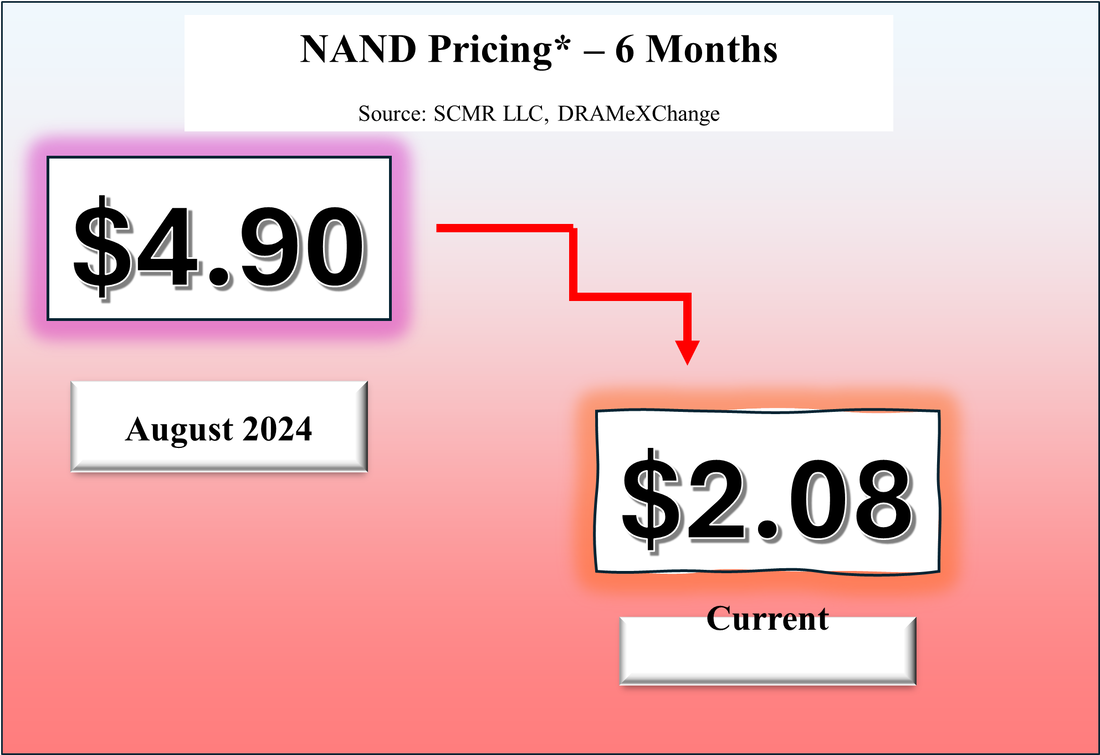
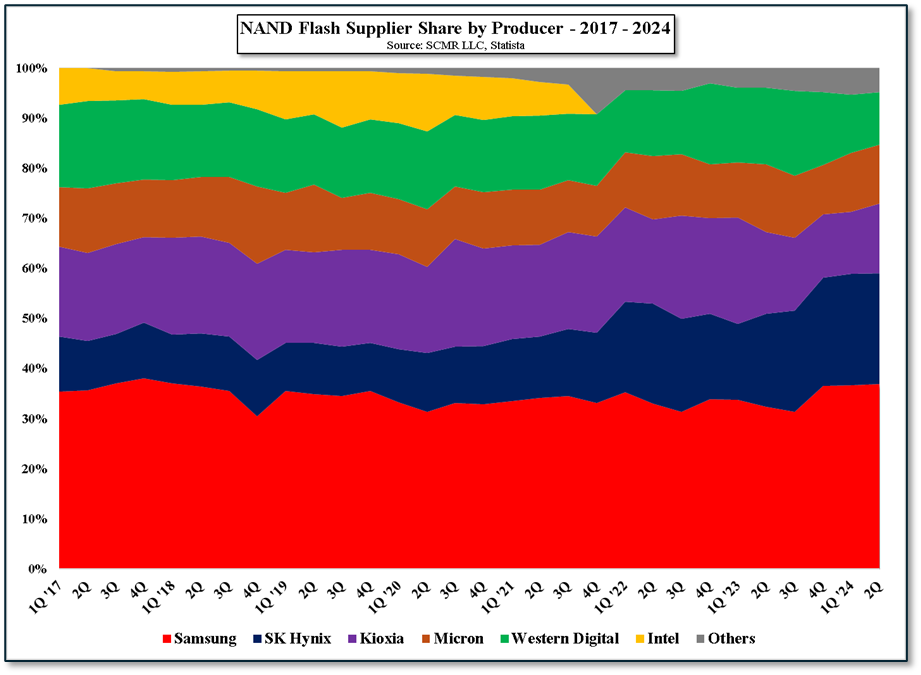
As the leader, Samsung tends to set the tone for the industry, and in March of 2024, a few months after a peak was reached in NAND pricing and inventory had built up to the point where an oversupply situation was obvious, Samsung cut NAND production by almost 50%.  Relatively quickly other producers followed and within a short time NAND prices stabilized and began to rise again.  Unfortunately, the slowdown in smartphone demand and a somewhat surprising weakening in enterprise SSD demand (given the AI hype) made NAND prices unable to hold early 2024 gains and a second decline began in 2H.
Samsung’s poor results in 4Q were the result of that weakness, and the company has decided to cut production at its fab in Xian, China, its largest NAND production fab, by more than 10%, from 200k wafers/month to 170k, and will also cut NAND production at two lines at its fabs in Hwaseong, South Korea.  Typically, one would expect the other NAND flash producers to follow relatively quickly but it seems that Samsung is the first to set the tone of trying to break the downward NAND pricing cycle this year, at least thus far.  While it has been a short time since Samsung signaled the NAND production cuts, we expect others to follow, however, given the continuing hype around AI and its positive influence on data center capacity and the need for SSD’s, it might prove more difficult to convince others to participate, particularly Samsung’s biggest rival in the NAND space, SK Hynix ((000660.KS), who has been and continues to add capacity for high-end NAND products.
 
Picture
Figure 1 - NAND Pricing - 6 Months - Source: SCMR LLC, DRAMeXchange ‘* General Purpose NAND – 128GB – 16x8 MLC
Picture
Figure 2 - NAND Flash Supplier Share - 2023 - Source: SCMR LLC, Statista
Picture
Figure 3 - NAND Flash Memory by Application - 2021 - Source: SCMR LLC, Storage Newsletter
Picture
Figure 4 - NAND Flash Supplier Share by Provider - 2017 - 2024 - Source: SCMR LLC, Statista
0 Comments

Bragging Rights or Making Money

1/13/2025

0 Comments


Bragging Rights or Making Money
​

Samsung Display (pvt) is the leader in the foldable smartphone display market, while they were not the first to release a foldable display, the competitor that beat them is no longer in business.  That said, the number of OLED display producers and phone brands that are producing displays or offering foldable smartphones has increased considerably since the initial releases back in 2019, at which point there were two brands Samsung Electronics (005930.KS) and Huawei (pvt).  While Motorola and others offer a number of models Samsung and Hiawei are still the volume (units) leaders and continue to battle to maintain (Samsun) or gain (Huawei) share in this relatively new market.
Picture
In September of 2024 Huawei released the Mate XT Ultimate, a tri-fold smartphone, that pushed the competitive envelope further.  Not to be outdone, it seems that Samsung has been discussing production plans with suppliers for its first tri-fold phone, which is expected to go into production in April.  While all components have not been finalized yet, scheduling is being discussed in order to make sure the components, a number of which are new, will be available to assemblers when necessary. It is expected that Samsung will produce `~200,000 units this year, an exceptionally small number compared to the 5m expected for this year’s Z Flip and Z Fold, which together represent less than 3% of Samsung’s smartphone shipments.  Samsung is also said to be developing a thinner version of the Z Flip 7 known as the Z Flip FE, a follow up to the Z Flip SE released this year, with total production, including previous models of ~7m units.
If Samsung is expecting to sell only 200,000 tri-fold smartphones this year, it indicates that Samsung is releasing the device in order to stay abreast of Huawei in terms of technology, but is less focused on generating sales, as both internal and external resources will be used  for the tri-fold device, potentially diluting the development of the higher volume Z Flip and Fold.  This comes at a time when the high price of foldable smartphones is slowing the segment’s growth and narrowing the customer base.  It is understandable that Samsung and others feel the need to complete by, at the least, matching existing technology, but the point of selling smartphones is to make money, which means the focus of any foldable device development program should be to bring down the price, rather than releasing a device to maintain bragging rights.
Samsung’s tri-fold device is expected to be just under 10” when open, while the Huawei device is 10.1” and the Z Fold FE is 10.6mm when folded while Chinese brands are between 9mm and 10mm when folded, so Samsung is not ‘breaking through’ specifications with its devices, it is just keeping pace.  With the relatively poor sales of the Z Fold SE (<100,000 units cumulative), this game is not bringing in new, high-volume customers, its saving face.  Instead of putting out a ‘me too’ product, we believe Samsung would be far better off skipping the tri-fold smartphone and working toward a 4-segment device, which would take a 6” (diagonal smartphone and create an unfolded display almost 6” high and 10.6” wide.  Yes, it would need four hinges and would be about 13mm thick, or slightly over ½ inch when folded, but it would open to the size of a medium to large size tablet.  Forget the copy and take a step ahead.
Picture
Picture
0 Comments

Can You Tell?

1/10/2025

0 Comments


Can You Tell?
​

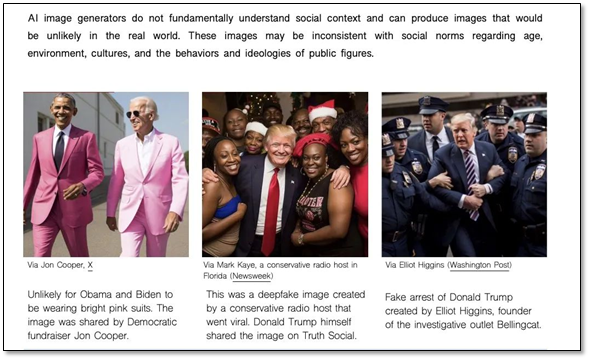
Deepfakes are and will continue to be a constant reminder of the potential downsides of AI.  The most recent example is a set of pictures of a small child stuck under debris from a collapsed building during a magnitude 6.8 earthquake in Shigatze City, Tibet.  At least 10 social media accounts posted these pictures, linking them to the earthquake, and received tens of thousands of reposts.  Tencent’s (700.HK) Jinzhen news platform eventually confirmed that the photos were Ai generated.
Picture
Figure 1 - Deepfake 1 - Source: 36KR.com
​AI still has issues with human hands and fingers and a closer look at one of the photos points to that issue as a tell.  Unless that child is polydactyl (1in a 1,000 chance), the AI incorrectly created an extra finger, indicating the creator was not using the latest AI image technology.  In March of 2023, Midjourney (pvt) solved this issue with its V5 release by training the model and then fine-tuning it with a massive set of annotated finger data, although even then with this time-consuming fine-tuning the Midjourney AI still had issues with the muscle placement and texture on fingers, which they further refined in Version 6.
Picture
Figure 2 - Deepfake 2 - Source: 36KR.com
Picture
Figure 3 - Midjourney Model 'Finger Updates' - Source: Midjourney
Picture
Figure 4 - Midjourney Muscle Issues - Source: Midjourney
Picture
Figure 5 - Midjourney V6 Finger Refinement - Source: Midjourney
As it turns out there are guides to discerning which images are real and which are fake.  In a manual posted by Northwestern University, they point to 5 keys to detecting fakes.
 
  • Anatomical Unreasonableness, such as unnatural hands, weird teeth, or unusual bones.
Picture
  • Stylization – Too clean or to cinematic?
Picture
  • Functional Irrationality – As an AI’s understanding of products and their use is limited, the placement of objects incorrectly is a key.
Picture
  • Physics Violations – Incorrect shadows or reflections or their eliminations is a tell.
Picture
  • Cultural or common-sense violations – These are harder to spot as they are extremely subjective
Picture
​If you believe you are better than average at picking out fakes, take the test at the link below, but remember that the difference in deepfake recognition accuracy of those who are familiar with AI and those who are not is only 0/8%.  While we do not believe that AI’s have anything close to human creative ability, they are pretty good at fooling us when it comes to images, and they get better, while we stay the same in terms of visual perception…
https://detectfakes.kellogg.northwestern.edu/
 
0 Comments
<<Previous
Forward>>

    Author

    We publish daily notes to clients.  We archive selected notes here, please contact us at: ​[email protected] for detail or subscription information.

    Archives

    May 2025
    April 2025
    March 2025
    February 2025
    January 2025
    January 2024
    November 2023
    October 2023
    September 2023
    August 2023
    June 2023
    May 2023
    February 2023
    January 2023
    December 2022
    November 2022
    October 2022
    September 2022
    August 2022
    July 2022
    June 2022
    May 2022
    April 2022
    March 2022
    February 2022
    January 2022
    December 2021
    November 2021
    October 2021
    September 2021
    August 2021
    July 2021
    June 2021
    May 2021
    April 2021
    March 2021
    February 2021
    January 2021
    December 2020
    October 2020
    July 2020
    May 2020
    November 2019
    April 2019
    January 2019
    January 2018
    August 2017
    July 2017
    June 2017
    May 2017
    April 2017
    March 2017
    February 2017
    January 2017
    November 2016
    October 2016
    September 2016

    Categories

    All
    5G
    8K
    Aapl
    AI
    AMZN
    AR
    ASML
    Audio
    AUO
    Autonomous Engineering
    Bixby
    Boe
    China Consumer Electronics
    China - Consumer Electronics
    Chinastar
    Chromebooks
    Components
    Connected Home
    Consumer Electronics General
    Consumer Electronics - General
    Corning
    COVID
    Crypto
    Deepfake
    Deepseek
    Display Panels
    DLB
    E-Ink
    E Paper
    E-paper
    Facebook
    Facial Recognition
    Foldables
    Foxconn
    Free Space Optical Communication
    Global Foundries
    GOOG
    Hacking
    Hannstar
    Headphones
    Hisense
    HKC
    Huawei
    Idemitsu Kosan
    Igzo
    Ink Jet Printing
    Innolux
    Japan Display
    JOLED
    LEDs
    Lg Display
    Lg Electronics
    LG Innotek
    LIDAR
    Matter
    Mediatek
    Meta
    Metaverse
    Micro LED
    Micro-LED
    Micro-OLED
    Mini LED
    Misc.
    MmWave
    Monitors
    Nanosys
    NFT
    Notebooks
    Oled
    OpenAI
    QCOM
    QD/OLED
    Quantum Dots
    RFID
    Robotics
    Royole
    Samsung
    Samsung Display
    Samsung Electronics
    Sanan
    Semiconductors
    Sensors
    Sharp
    Shipping
    Smartphones
    Smart Stuff
    SNE
    Software
    Tariffs
    TCL
    Thaad
    Tianma
    TikTok
    TSM
    TV
    Universal Display
    Visionox
    VR
    Wearables
    Xiaomi

    RSS Feed

Site powered by Weebly. Managed by Bluehost